

NEW FEATURE ADDED: QHP *only* Graph
Mon, 09/29/2014 - 9:50am
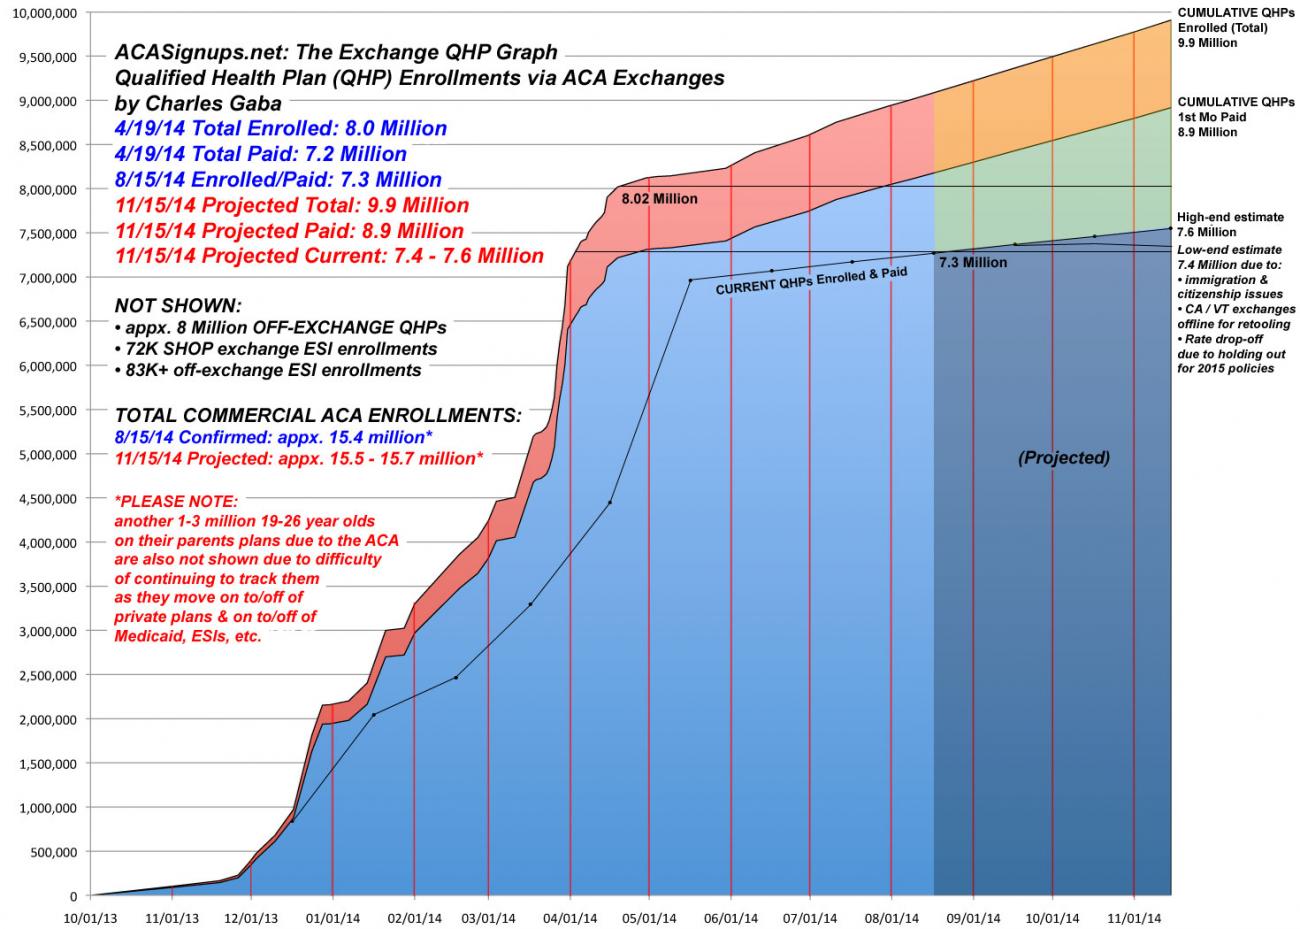
As we approach the 2nd Open Enrollment period, and as The Graph has become far too unwieldy to keep laid out in its current format, I've decided to break out the commercial plans (Exchange-based QHPs, plus references to the off-exchange QHPs, ESIs via SHOP exchanges/etc. and "sub26ers") onto their own graph. As you can see, this allows me to add another important new feature: My projection of the currently enrolled/paid up figure at any given time. We're also close enough to Year Two now (and my projections to date have proven accurate enough so far) that I'm comfortable projecting the QHP graph forward through November 15th (at which point Year Two starts up).
The 11/15 projections (as well as the "currently enrolled" line) assume a 9,000 new enrollments per day, a 90% payment rate, and a 2% average monthly attrition rate. This lines up almost precisely with the recent CMS announcement that 7.3 million people were currently enrolled & paying as of August 15th.
I've posted the QHP Graph below, but a larger version can be seen at the new official link.
UPDATE: Also note the all-new Medicaid/CHIP Only Graph.
UPDATE x2: I should also clarify that the 7.6M as of 11/15 is a high-end estimate. That number assumes 9K/day being added every day right up through 11/14, which probably isn't likely; there will almost certainly be a significant drop-off in the final few weeks, since anyone not in immediate need of coverage will be very likely to just stick it out for another couple of weeks until the 2015 open enrollment period starts up again on 11/15, with new policies, new premiums and so forth to choose from.
In addition, there's also other factors which will come into play between now and 11/15, such as CoveredCA being offline for a couple of weeks for retooling (it just came back online earlier today) as well as the Vermont exchange also being offline for retooling from 9/15 right up through 11/15. Those two factors alone will likely lop off perhaps 30,000 from the total.
Finally, there's the 115,000 citizenship/immigration data issues yet to be resolved by HHS (and presumably a smaller number on the various state exchanges). Assuming, say, 150K total, and assuming half of them are resolved with the enrollees keeping their coverage, that's another 75K to subtract from the November count.
So, all in all it sounds like the 11/15 current total may end up being perhaps 100K - 150K lower than the high-end...perhaps 7.4 - 7.5 million.
Advertisement
