

THE GRAPH: #ACATaxTime Speculation (& Effectuated Enrollments!)
Mon, 03/02/2015 - 3:05pm
A few weeks back I posted a wildly speculative look at what the rest of 2015 might look like (assuming, that is, that the Supreme Court doesn't blow all of my enrollment models out of the water this June with a horrible King v. Burwell ruling).
At the time, I made a pretty ambitious assumption about how many people might enroll during the special 2015 Tax Filing Season enrollment period...I figured a good 1.8 million might do so.
Since then, I've thought it over and decided to be more cautious--I honestly have no clue how many people will follow through and enroll during this period (all I know for sure is that the total number eligible to enroll is somewhere between 0 and 6 million nationally). In the interest of caution, I'm lopping this down to just 1 million even today (it could be higher or lower, of course).
My other assumptions remain the same: An 88% payment rate (for the 1st month) and a roughly 2% net monthly attrition rate, plus about 9K/day enrolling during the "truly" off-season (ie, no special enrollment periods, major life events only).
Finally, instead of trying to push things out for the full calendar year (which is insane without knowing what the heck the SCOTUS is planning), I'm cutting the new Graph off at the end of April (which is when the Tax Season enrollment period ends for just about every state).
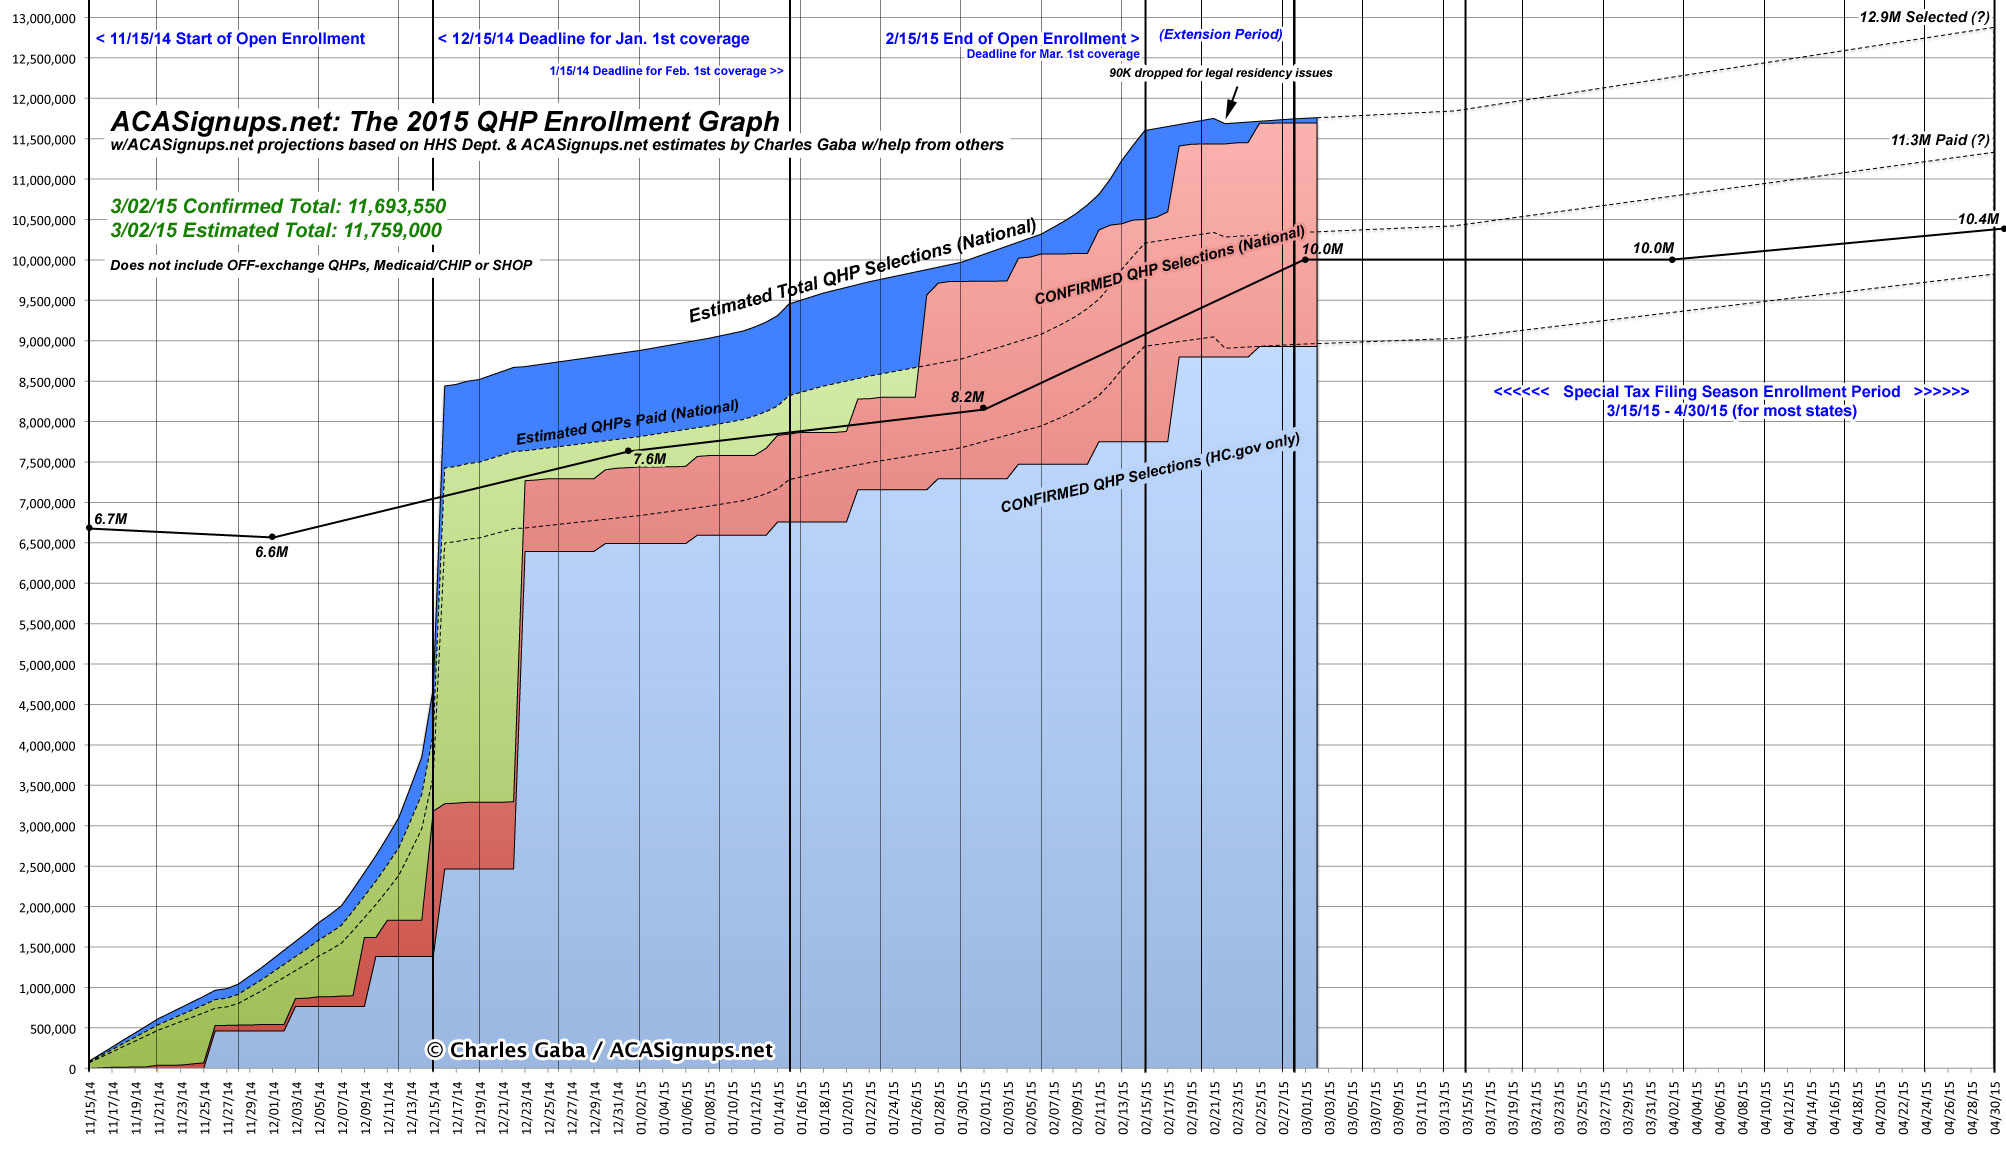
With all that in mind, here's how I see the next 2 months playing out (warning: The table is pretty wide and The Graph is huge now...click below for the full-size version in a new browser window).
As you can see, assuming that I'm reasonably close with these estimates, the number of people actually paid and effectuated as of any given date throughout the year should have started at around 7.6 million on January 1st and hit around 10 million even on March 1st. It should hover at around 10M for April, then jump up to around 10.6 million by June as the wave of tax season enrollees kick into effect.
ASSUMING that the SCOTUS shoots down the King plaintiffs (which is, of course, a huge assumption), I would then expect it to plateau at around 10.7 million before starting to drift back downwards again into the fall...at which point the 2016 Open Enrollment Period would start the whole cycle over again for a 3rd go-around (May - December are shown in the table but not on the Graph).

Advertisement
