

BOOM: Latest quarterly Gallup poll shows uninsured rate down to 12.3% (or lower!)
Wed, 03/04/2015 - 3:46pm
A couple of weeks ago, Gallup released a massive Health Insurance Survey which noted that the uninsured rate nationally fell from 17.3% to 13.8%. On the one hand, yay Obamacare! On the other hand, this drop in the uninsured was far less impressive-sounding than earlier surveys put out by the Urban Institute, Commonwealth Fund, RAND Corporation...and even Gallup itself.
There was an obvious reason for this, however:
In other words, they surveyed a mountain of people, but the polling was spread out over the full course of each year. These are full-year averages. There's nothing wrong with this, and 10 years from now it will be more practical to look at historical data from a year-to-year perspective. At the moment, however, things are changing very rapidly as enrollments/expansion/policy implementation goes into effect, and a month-to-month or quarter-to-quarter perspective is far more telling.
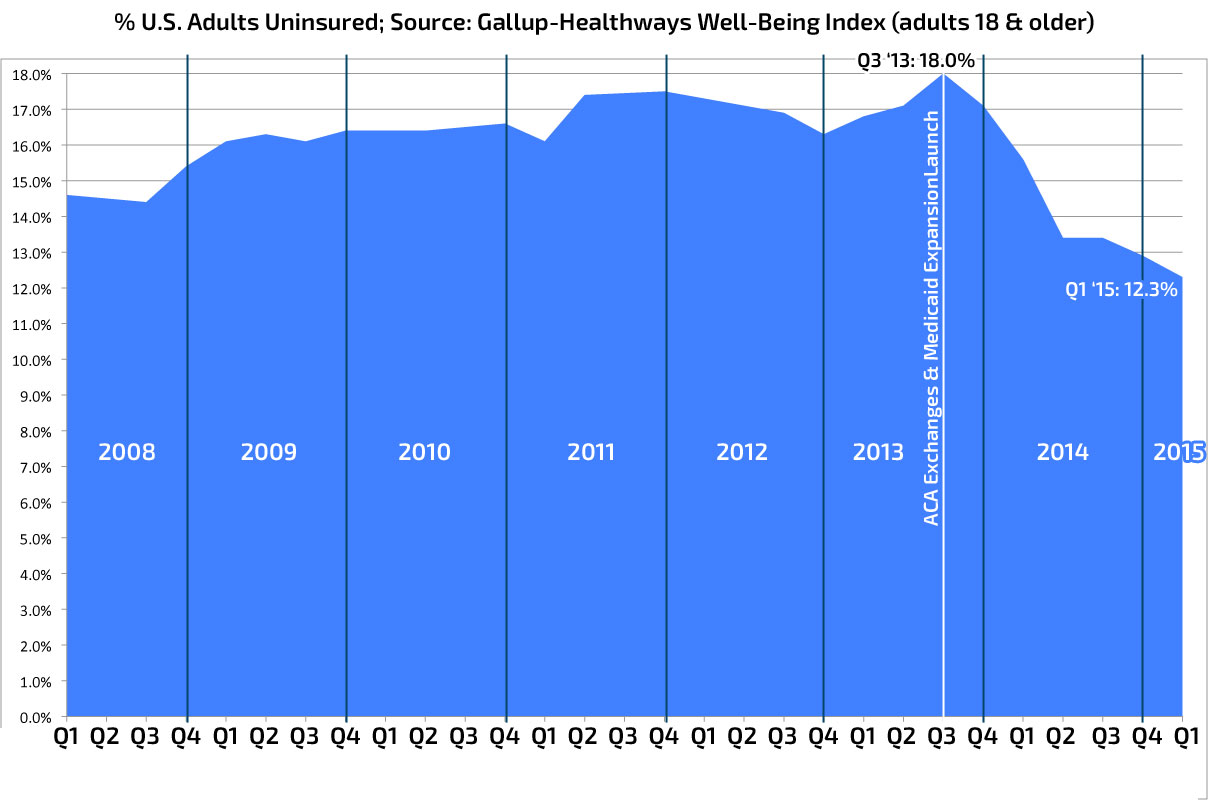
Again, just before Healthcare.Gov and the state-run ACA exchanges launched (or tried to launch, anyway) in October 2013, the national uninsured rate, according to Gallup, was actually 18.0% even.
In 2013 the total popluation was around 316 million. The Gallup poll doesn't include kids under 18 (around 23.3% of the total), so that's around 242 million adults. 18% of that is roughly 43.6 million people uninsured just before the ACA exchanges (and Medicaid expansion) launched.
Enter today's snapshot poll results from Gallup, which specifically cover January and February only of 2015:
The results are based on more than 27,800 interviews conducted from Jan. 2 to Feb. 28, 2015, as part of the Gallup-Healthways Well-Being Index. Gallup and Healthways ask 500 U.S. adults each day whether they have health insurance, allowing for precise and ongoing measurement of the percentage of Americans without health insurance.
And the results of this survey, which measures the situation over the past 2 months?
The uninsured rate among U.S. adults is 12.3% for the first two months of 2015, down marginally from 12.9% in the fourth quarter of 2014.
That's right: Given that the total population has grown a few million over the past year and a half (to around 319 million), that means that the total adult uninsured number is now down to around 30 million even (again, this doesn't include kids under 18):
319M x 76.7% adults x 12.3% = 30,094,779
But wait, there's more!
Remember, while today's Gallup polll includes January and February, it doesn't include March 1st, when around another 2.1 million ACA exchange-based policies kicked in. Not all of these were previously uninsured, of course, but if even half of them were, the uninsured rate may have dropped by another cool million:
The open enrollment period for Americans to purchase a healthcare plan for 2015 through the Health Insurance Marketplace ended Feb. 15, but this deadline was extended to Feb. 22 -- and even longer for some applicants. Many states extended their enrollment deadlines even longer, and this report would not fully reflect those who obtained health insurance right before the deadline.
The uninsured rate for the first two months of the year is down 0.6 percentage points from the fourth quarter of 2014. Gallup and Healthways will publish the results for the entire first quarter in early April, and if the downward momentum continues, the drop in the uninsured rate may be slightly larger than this preliminary figure.
Furthermore, anyone who enrolled/enrolls between around February 23rd and March 15th (varies by state) will start coverage on April 1st...and then, on May 1st, the bulk of the #ACATaxTime Special Enrollment Period enrollees will be kicking into gear. Don't forget off-exchange enrollees, ongoing Medicaid expansion, etc...I wouldn't be at all surprised to see the national uninsured rate drop to below 12% by April.
IMPORTANT CLARIFICATION: So, what about the kids? Well, 23.3% of 319M = around 74 million. According to the Kaiser Family Foundation, the national uninsured rate among kids 0-18 in 2013 (no specific date given) was around 8%, or around 5.9 million. Since then, I'm assuming it's gone down as well...assuming a similar relative drop (12.3 / 18.0), that would bring the number of uninsured kids down to perhaps 5 million, for around 35 million people total nationally...which would mean a TOTAL uninsured rate of just 11.0% nationally.
And again, that's before the March 1st enrollees are added to the mix. Lop off another million or so and you're down to around 10.6%.
If I'm correct about another million or so taking advantage of the #ACATaxTime enrollment period (and no, I have no clue how many actually will), then it's safe to say that just about all of them can be subtracted from the uninsured pool (otherwise they wouldn't qualify to enroll for the tax season special enrollment period in the first place). That could conceivably bring the total down to as low as 33 million nationally (including children), or as low as 10.3%.
Chew on that, Supreme Court...
UPDATE: Here's a full version of Gallup's own quarterly graph; my version is actually more honest because it shows the whole Y axis instead of just the part that changes. It's a shame that these numbers don't include children under 18.
Even so, the drop since October 2013 (when the ACA exchanges were launched and people could start enrolling in Medicaid expansion) is still quite dramatic.
Advertisement
