

THE GRAPH, Post-King v. Burwell Plaintiff Win Edition
Mon, 06/15/2015 - 2:32am
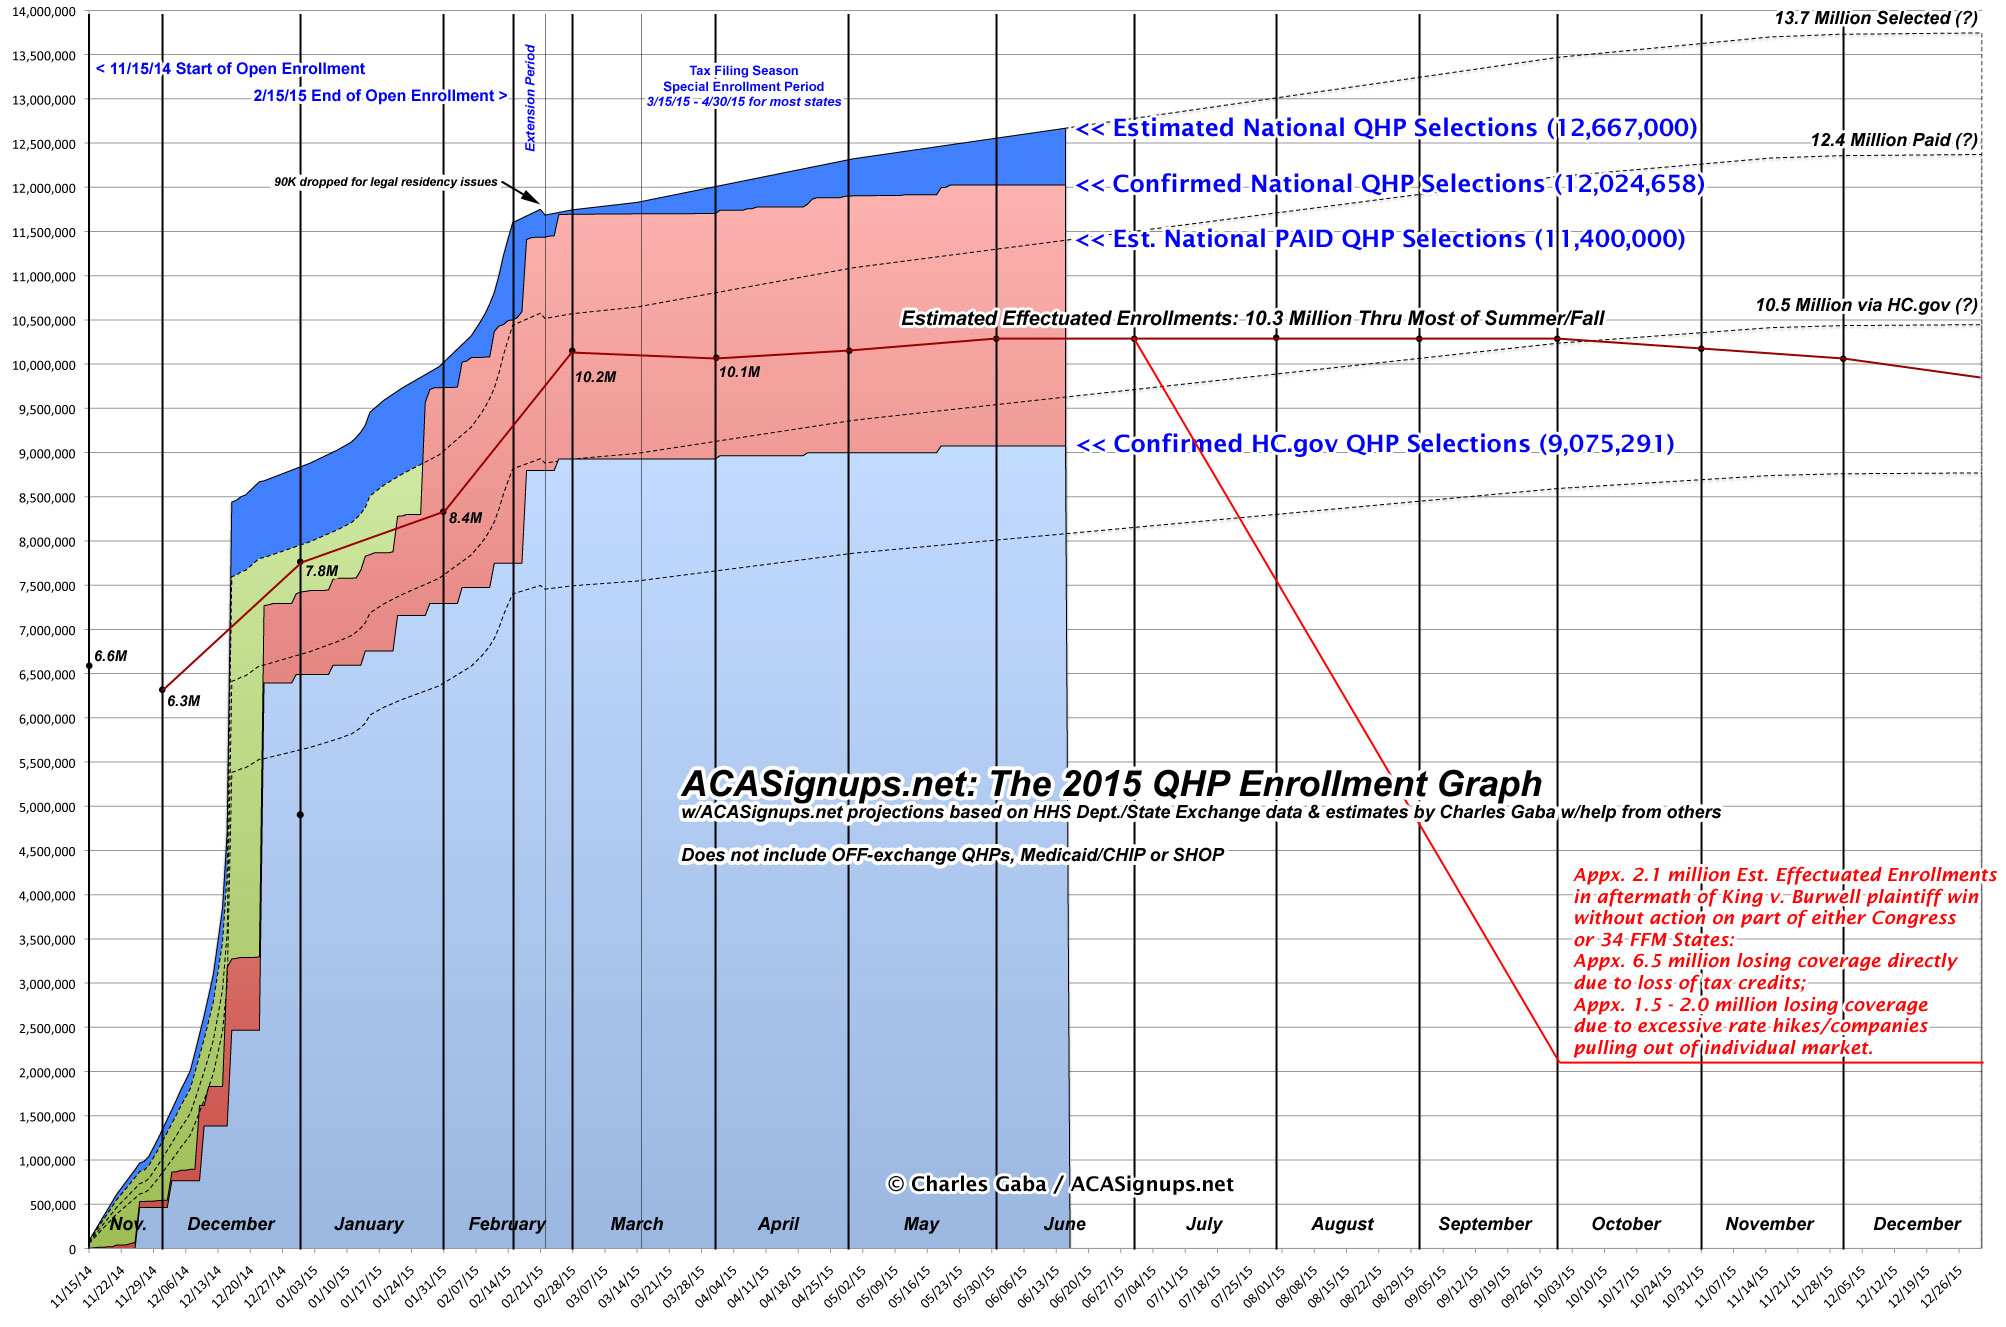
I've made a slight modification to The Graph. Instead of projecting just how many would lose their tax credits, the new version plots the likely total loss of actual QHP enrollees either directly (i.e., those who lose their credits...around 6.5 million) or indirectly (i.e, those who are currently paying full price for their premiums but would likely have to drop that coverage due to the massive (50%+) rate hikes being projected by several studies in response to the adverse selection factor...around 1.5 - 2.0 million by my estimates).
Since the ACA requires insurance companies to continue coverage for existing policyholders for 90 days after they fail to make a payment, most of the expected drop-off probably wouldn't officially happen until the end of September (assuming that the tax credits are actually cut off starting with the July premiums).
Technically, the additional 1.5 - 2.0 million likely wouldn't have to drop their policies until next year, since the 2015 rates should be locked in for most of them until January, but that would complicate the graph even more, Besides, the post-King v. Burwell disruption could cause a domino/trigger effect even in 2015 as insurance companies in those states react to the mess.
Alternately, here's a far simpler visual representation of the potential aftermath.
Advertisement
