

Families USA releases King v. Burwell fallout by Congressional District
Tue, 06/16/2015 - 9:20pm
Three weeks ago I posted my best-guess estimates of just how many people would actually lose their federal tax credits in each state in the event of the Republican Party and CATO Institute winning the King v. Burwell case at the Supreme Court.
I also noted that if you cross-reference this data with this handy interactive map provided by Enroll America, you can even figure out roughly how many people would be screwed in every county in each state, by dividing the state-wide percentage receiving subsidies by the total number enrolled per county.
Finally, I noted at the time that you could even drill down further if you wanted to, to the zip code level, by using this massive Excel enrollment spreadsheet from the HHS Dept. itself. Again, take the total number of enrollees, divine the percentage currently enrolled & receiving subsidies state-wide by that number and you should get a rough idea of how many would lose those tax credits on a zip code-by-zip code basis.
More than one person suggested that I go one step further and slice up the King v. Burwell fallout by U.S. Congressional District...but that would really require a ton of work and goes beyond the scope of my available time. Great idea, however.
As it happens, just one week later, the CMS division of the HHS Dept. went ahead and released the actual state-by-state effectuated enrollment data...including the exact number of people receiving federal tax subsidies in each state as of 3/31/15. The grand total was almost identical to my estimates (around 6.4 million), and I was within 5% in 25 of the 34 states in question...not bad, although actually you have to tack on about another 100,000 to both totals to reflect the additional folks who enrolled during the Tax Filing Season Special Enrollment Period.
So...great! Now we have updated state-by-state numbers...but again, breaking things out by Congressional District would certainly be helpful, right?
Well, guess what? Families USA decided to do exactly that:
The Supreme Court ruling later this month in King v. Burwell could threaten the health coverage of millions of people. Our series of state-specific infographics shows that in each congressional district, there are thousands of consumers who are at risk of losing their health insurance. The map below shows the 34 states where 6.4 million Americans stand to lose the financial assistance that enables them to afford health coverage.
They then provide links to individual state-by-state Congressional District infographics. They only have the first 12 states so far; the other 22 states will be released on Thursday and next Tuesday:
State Infographic Release Schedule
- June 16: AL | AR | FL | GA | LA | MO | MS | NC | SC | TN | VA | WV
- June 18: AK | AZ | KS | MT | ND | NE | OK | SD | TX | UT | WY
- June 23: DE | IA | IL | IN | ME | MI | NH | NJ | OH | PA | WI
I should also note that their methodology was exactly what mine would be if I were to have the time/resources to complete this project:
How We Calculated Congressional District-Level Estimates:
- We first matched each zip code from the ASPE data set, “Plan Selections by ZIP Code in the Health Insurance Marketplace,” with its corresponding congressional district from the Greatdata.com matching document. Zip codes with multiple congressional districts were matched with each of the applicable districts as follows: For those districts, the percentage of the zip codes’ addresses in each district was multiplied by the total enrollment for the zip code. For example, zip code 19120 had 3,283 enrollees; 87 percent of that zip code is in Pennsylvania’s 13th district, and 13 percent is in the 2nd district. Therefore, we assigned 2,856 enrollees (87 percent of 3,283) from that zip code to the 13th district and 394 to the 2nd district.
- The enrollments per zip code for each congressional district were then added together to arrive at one number representing the total enrollment for each congressional district.
- Because the zip code data do not include the effectuated data (data on those individuals who selected plans and paid their premiums), and because the most recent state-by-state enrollment report (the CMS March 31, 2015, Effectuated Enrollment Snapshot) does include the effectuated data, we adjusted each congressional district’s numbers to match the data in the CMS report.
- First, we determined how enrollment in each state had changed between February 22 (the last day counted in the data set from ASPE, “Plan Selections by ZIP Code in the Health Insurance Marketplace”) and March 31 (the last day counted in the CMS March 31, 2015, Effectuated Enrollment Snapshot). To do this, we used the ASPE Health Insurance Marketplaces 2015 Open Enrollment Period: March Enrollment Report, which also has enrollment data through Feb 22, to determine the state-wide totals as of February 22, which we then divided by the statewide totals in the CMS report (March 31, 2015, Effectuated Enrollment Snapshot).
- For example, enrollment in Ohio as of February 22 was 234,341, and the effectuated enrollment was 188,867 as of March 31. Therefore, the ratio between the two dates was 80.59 percent (188,867 ÷ 234,341). We then multiplied each congressional district by its state’s change in enrollment to estimate March 31 enrollment in the district. For example, as of February 22, enrollment in Ohio’s 12th district was 14,227. We multiplied that total by the statewide change of 80.59 percent, which yielded an estimated enrollment of 11,466 as of March 31.
- We then used the percentage of enrollees receiving premium tax credits for each state from the CMS March 31, 2015, Effectuated Enrollment Snapshot and multiplied that percentage by the number of enrollees in each congressional district to reach an estimate of the number of consumers per congressional district who are at risk of losing their premium tax credits.
- For example, we estimated that 46,765 people were enrolled in marketplace plans in Florida’s 10th congressional district. According to the CMS March 31, 2015, Effectuated Enrollment Snapshot, 93.5 percent of marketplace enrollees are receiving premium tax credits in Florida. Therefore, we calculated that 43,725 people will lose premium tax credits in Florida’s 10th district should the Supreme Court rule against the government.
- For states with just one at-large congressional district, we show only state-wide data from the CMS March 31, 2015, Effectuated Enrollment Snapshot.
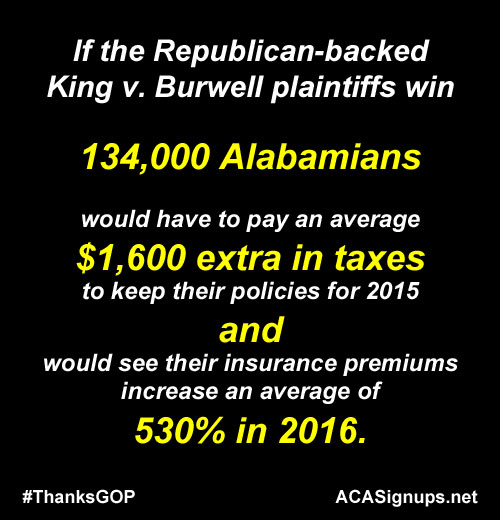
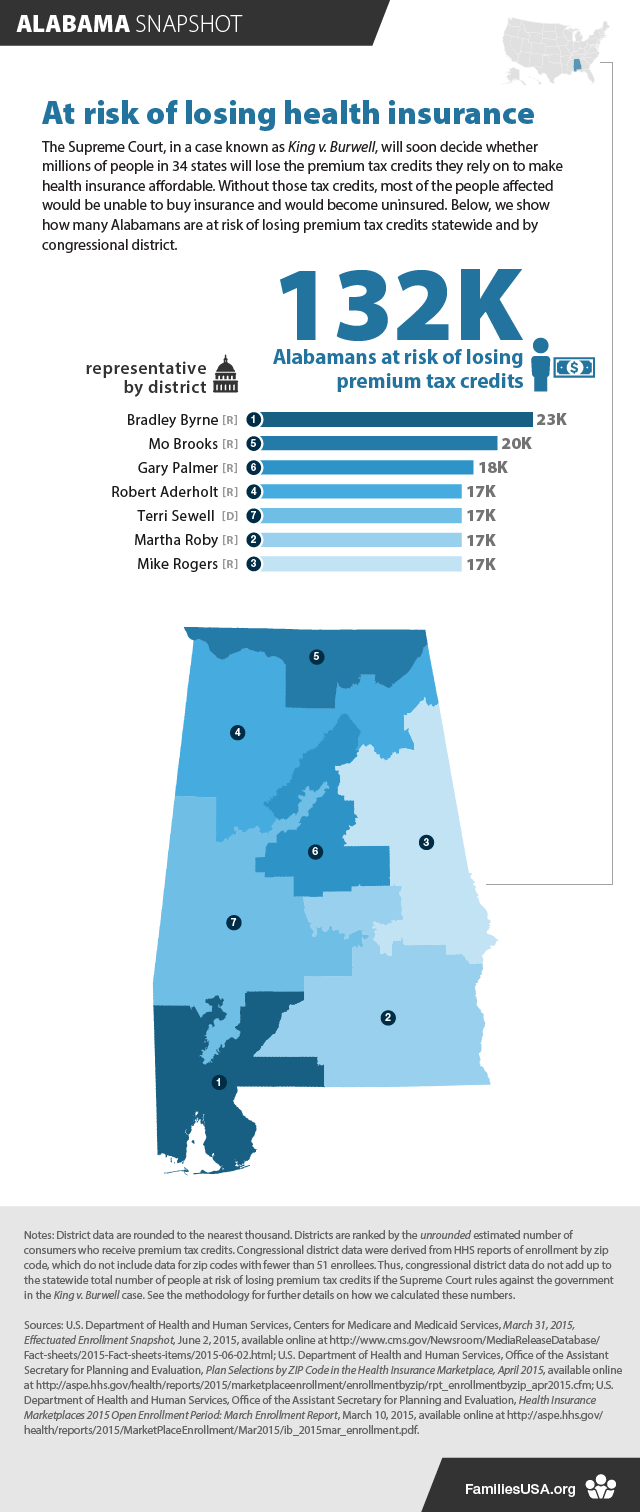
The end result of all of this number-crunching is that Families USA has provided Congressional District versions of the statewide Infographics which I whipped up about a week ago. For instance, here's the one I did for Alabama, followed by Families USA's CD-level version.
NOTE: For each state, my total number is slightly higher than Families USA's number because I'm also including the portion of the additional 100,000 or so people who should be receiving tax credits nationally since the end of March:
Bravo to Families USA for a job well done. Now if only the Democrats are smart enough to actually use all of these data and graphics...
Advertisement
