

UPDATED: Gallup releases state-by-state uninsured drop; AR & KY getting the headlines, but check out Rhode Island!
Mon, 08/10/2015 - 9:37am
I was kind of hoping that this morning's Gallup uninsured rate news would include a monthly update for July; instead, it only runs through the end of June, the same quarterly survey results that they released a month ago. Then again, things probably didn't change much in July.
Instead, this time they've broken the numbers out by state:
WASHINGTON, D.C. -- Arkansas and Kentucky continue to have the sharpest reductions in their uninsured rates since the healthcare law took effect at the beginning of 2014. Oregon, Rhode Island and Washington join them as states that have at least a 10-percentage-point reduction in uninsured rates.
Seven of the 10 states with the greatest reductions in uninsured rates have expanded Medicaid and established a state-based marketplace exchange or state-federal partnership, while two have implemented one or the other. The marketplace exchanges opened on Oct. 1, 2013, with new insurance plans purchased during the last quarter of that year typically starting on Jan. 1, 2014. Medicaid expansion among initially participating states also began with the onset of 2014. As such, 2013 serves as a benchmark year for uninsured rates as they existed prior to the enactment of the two major mechanisms of the healthcare law.
Through the first half of 2015, there are now seven states with uninsured rates that are at or below 5%: Rhode Island, Massachusetts, Vermont, Minnesota, Iowa, Connecticut and Hawaii. Previously -- from 2008 through 2014 -- Massachusetts had been the only state to be at or below this rate. No state, in turn, has reported a statistically significant increase in the percentage of uninsured thus far in 2015 compared with 2013. Nationwide, the uninsured rate fell from 17.3% in full-year 2013 to 11.7% in the first half of 2015.
It's important to note that the numbers below are for the full period listed, not just 1 quarter. For instance, nationally, Gallup reported an 18.0% uninsured rate for Q3 2013 (just before the ACA exchanges launched), and 11.4% for Q2 2015 (ie, May - June of this year). For the full year 2013, Gallup reports it as 17.3%, vs. 11.7% for the full first half of 2015. In other words, if you used the quarterly numbers only for both the 2013 and 2015 rates, the impact would look even more dramatic.
Here's the actual numbers from Gallup, reformatted to highlight a few things...for instance, DC wasn't included for whatever reason, and I've also included the % drop for each state:
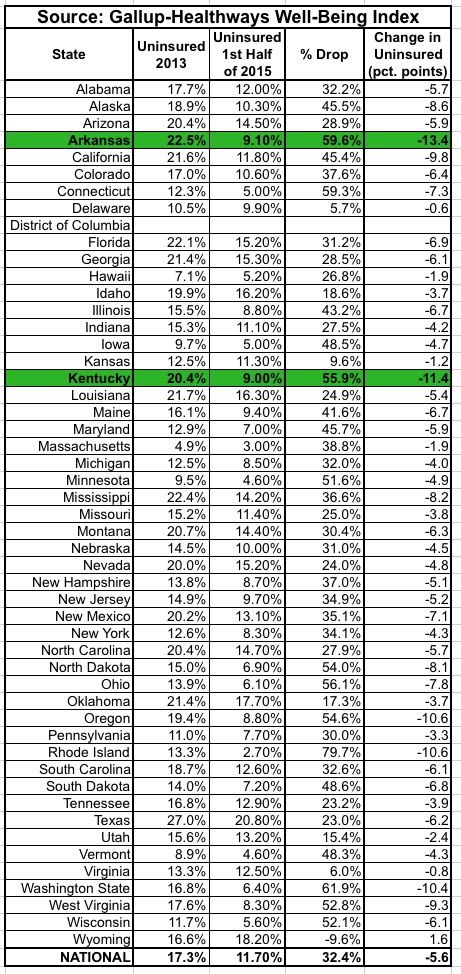
By plugging the numbers into my own spreadsheet, I can also resort them to highlight some other important points. First, here's what it looks like when sorted by percentage point drop from highest to lowest:
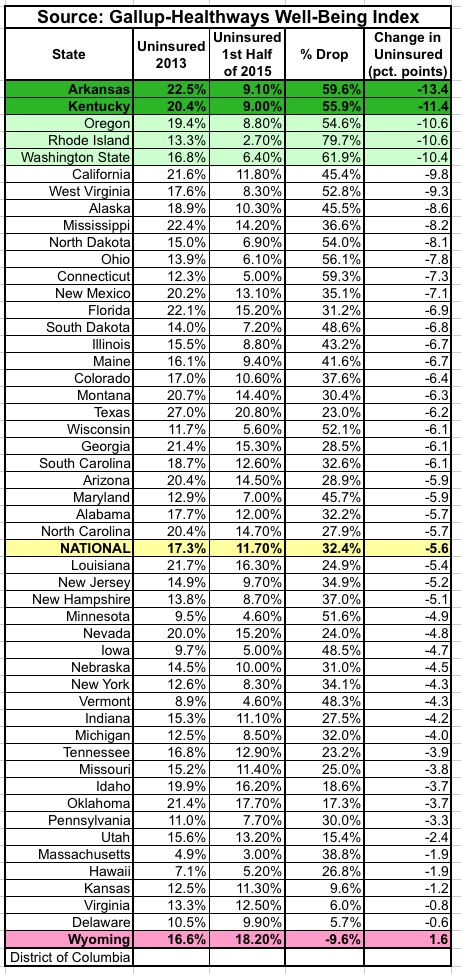
Arkansas and Kentucky continue to lead the pack in terms of the absolute percentage point reduction: 13.4 and 11.4 point drops respectively, vs. 5.6 points nationally. At the opposite end, Wyoming has somehow managed to increase their uninsured rate a bit, which I would imagine is due to a combination of local economic conditions and Gallup's margin of error? It should be noted that Kansas, which reported a similar uninsured increase last year is now showing a small but definite drop since 2013 of 1.2 percentage points.
Next, here's what it looks like when sorted by percent drop (which is not the same as percentage points):
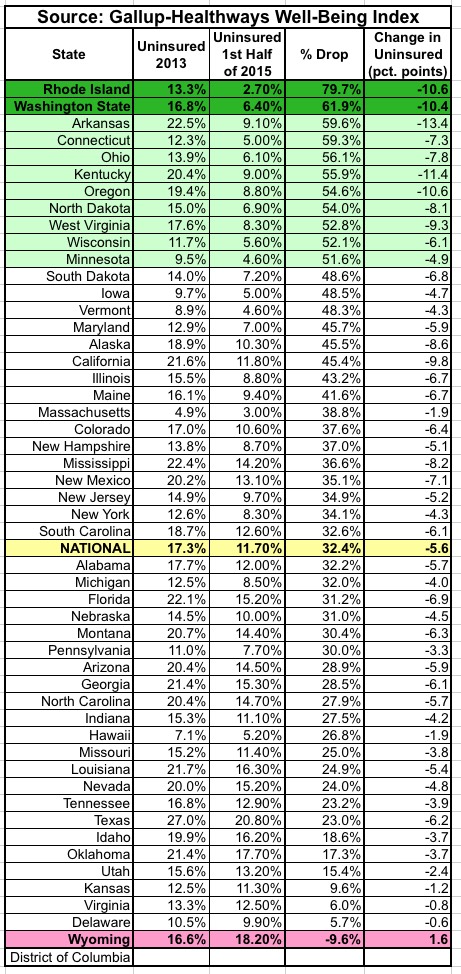
Holy smokes. Check out Rhode Island. Unless there's a typo here (and I'm pretty sure Gallup double-checked this before posting these numbers), the smallest state in the country had the largest drop on a percentage basis...an astonishig 80% drop in their uninsured rate, from 13.3% in 2013 to just 2.7% now. This also means that RI has now surpassed Massachusetts (3.0%) to become the state with the lowest overall uninsured rate in the country. Washington State is also kicking ass, having dropped 62% in the past year and a half.
UPDATE: As pointed out by Larry Levitt of the Kaiser Family Foundation, one important caveat: Rhode Island's portion of the survey has a very small sample size for the 2015 numbers, as do several other states (Alaska, Delaware, Hawaii, North Dakota, South Dakota and Wyoming). This means that RI's amazing results might not be quite so impressive after all, while (as noted earlier) Wyoming's "increase" in uninsured residents might not be the case at all. Gallup lists the margin of error as +/- 1-2 percentage points for most states, but +/- 4 percentage points for the 2015 results for these 7 states (the 2013 sample sizes were pretty good for every state, however).
If I'm understanding the MoE correctly, that means that Rhode Island's 2015 rate could theoretically be as high as 6.7% (or potentially...negative 1.3%, which obviously isn't possible), while Wyoming could potentially be anywhere from 14.2% (a 15% drop) to 22.2% (a 34% increase).
Finally, let's sort the states by the actual uninsured rate today:
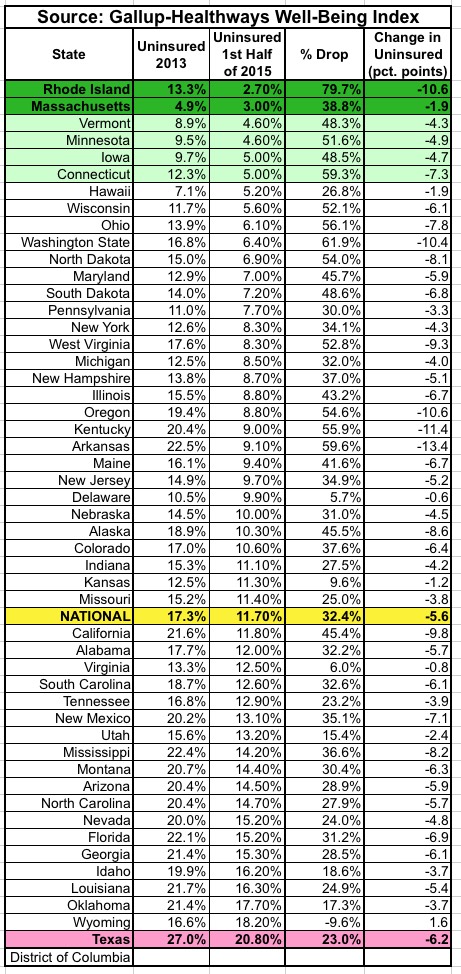
Rhode Island and Massachusetts have whittled their uninsured rates down to 3% or less, with Vermont, Minnesota, Iowa and Connecticut all at 5% or under.
Meanwhile, at the opposite end of the scale you have, as always, Texas...which still has more than 1 out of 5 residents uninsured despite a 23% drop, which goes to show just how ugly things were there before the ACA provisions went into effect.
Advertisement
