

Heritage Fdn. claims only 3% of Obamacare newly-insured is from private policies; actually over 30%.
Wed, 10/21/2015 - 5:04pm
UPDATE: I'm promoting this to the top of the front page for a bit. I didn't think this particular bit of nonsense from the Heritage Foundation would gain much traction because it sounded so absurd, but it apparently is being spewed via FOX News, Hot Air and other right-wing outlets, so debunking it has taken on a higher priority. I've also tidied up some of the wording for better readability.
Before I get into this, let me make one thing clear: I have made plenty of factual data mistakes myself over the past two years, and there have been times when I've made overzealous claims which were later proven to be false.
Here's the thing, though: I link to all of my source data, and if I extrapolate the final number from that data, I explain (in detail) how I got to the final number. Occasionally the source data is incomplete, or fuzzy; if so, I state as much...and I always add plenty of "I could be wrong" or "assuming such-and-such is the case" caveats to cover myself. Why? Because this stuff is messy, complicated and a lot of it is like trying to nail Jell-O to the wall...while that Jell-O is still moving. A number which was accurate as of January may be mostly irrelevant by June and utterly pointless by September.
The above preface has been added because the Heritage Foundation--the right-wing think tank which, ironically, was where the Affordable Care Act originated back in the days of Hillarycare and Newt Gingrich's reign as Speaker of the House--has posted quite the fish story. My favorite Heritage-spawned story is this migraine-inducing pile of feces by Sharyl "Broken Keyboard = Obama Hacking my Computer!" Attkisson, posted at the Daily Signal (a front for the Heritage Foundation) in June 2014.
However, I digress. Today's Heritage talking point tries to claim that over 97% of the net increase in Americans with healthcare coverage in 2014 was due to Medicaid/CHIP expansion, with less than 3% via the expansion of the private individual market (in particular, the ACA exchanges):
Health insurance enrollment data for 2014 shows that the number of Americans with health insurance increased by 9.25 million during the year. However, the vast majority of the increase was the result of 8.99 million individuals being added to the Medicaid rolls. While enrollment in private individual-market plans increased by almost 4.79 million, most of that gain was offset by a reduction of 4.53 million in the number of people with employment-based group coverage. Thus, the net increase in private health insurance in 2014 was just 260,000 people.
Wow. That's quite a claim, with a lot of numbers being thrown around. Let's see what they have to say before diving in:
Analysis of enrollment data for private health insurance plans and public programs finds that 9.25 million more Americans had health insurance coverage at the end of 2014 than at the end of 2013.
Before I go any further, let's all celebrate the fact that the Heritage Foundation is, at the very least, finally admitting that yes, 9.25 million more Americans had healthcare coverage one year after the biggest provisions of the Affordable Care Act went into effect. This may not seem like a major admission, but given that you had Republican nutbags like former NH Senator/Governor Judd Gregg trying to claim that the uninsured rate has barely changed at all (based on his misunderstanding of the difference between "percentage" and "percentage point") and outgoing Speaker of the House John Boehner even going so far as to try and claim that there's been a net increase in the uninsured, this is actually quite a big baby step into reality for the Heritage folks.
One other important sidenote: Even if Heritage was correct about their claim, the issue of whether there's anything inherently "wrong" with adding more low-income folks to Medicaid in the first place is a completely separate philosophical & economic argument, but that's for another time. This entry is purely about whether they're correct or not.
Moving on...
However, the data (see Figure 1) also show that the ACA’s Medicaid expansion was responsible for almost all of the net increase in coverage.
"Figure One" is a fun-looking but absurdly overcomplicated series of colorful balls depicting various increases and decreases in different types of healthcare coverage, but here's what it looks like in a more boring, table format:
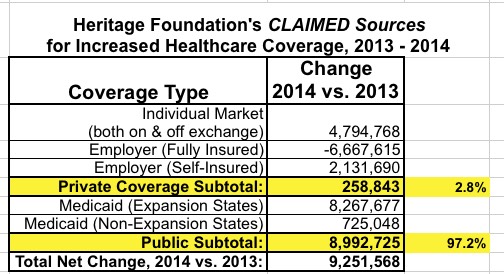
I'm going to skip over the fact that Heritage couldn't even get the basic math correct here (they actually overstate the Private Coverage subtotal by 1,000). The main point is that according to the Heritage Foundation, a whopping 6.6 million people left Employer Sponsored Coverage last year (partly cancelled out by 2.1 million being added to "self-insured" Employer coverage). According to Heritage, this means a net loss of 4.5 million ESI enrollees:
Enrollment in individual-market policies increased by almost 4.8 million individuals during 2014. For the employer-group-coverage market, enrollment in fully insured plans dropped by 6.6 million individuals, while enrollment in self-insured plans increased by 2.1 million individuals.[2] The net effect of those changes was a decrease of 4.5 million in the number of individuals with employer-sponsored coverage in 2014.
Because the reduction in employer-group coverage offset almost all of the increase in individual-market coverage, the net change in private-market coverage during 2014 was an increase of just 260,000 individuals.
OK, so that's where they get their "97% to 3%" claim, right?
I'll come back to the ESI numbers in a moment, because that's the crux of their whole argument, but first, I should also note that they go on to correctly state the Medicaid numbers (which makes sense, since they're trying to beef up Medicaid/CHIP's portion of the total gain...because Medicaid/CHIP are "evil" or something):
In contrast, total Medicaid and Children’s Health Insurance Program (CHIP) enrollment increased by almost 9 million individuals in 2014. Not surprisingly, Medicaid enrollment growth differed sharply between those states that adopted the ACA’s Medicaid expansion and those that did not. States with the ACA’s Medicaid expansion in effect experienced Medicaid enrollment growth of almost 8.3 million people, while the increase in Medicaid enrollment for the states without the expansion in effect was 725,000 people.
One thing, though: The problem here is that they're assuming that every single one of the new Medicaid enrollees were previously uninsured. Now, don't get me wrong; I'm sure most of them were...but definitely not all. How do I know this? Well, as reported by both the New York and Kentucky exchanges last year:
In Kentucky, 75 percent of the nearly 65,000 people who enrolled in private Obamacare insurance sold on the state-run exchange were uninsured at the time they enrolled, according to questionnaires they filled out when they applied. And 75 percent of people who enrolled in Medicaid via the exchange likewise had been uninsured.
In New York, 59 percent of the nearly 343,000 private Obamacare plan enrollees reported being uninsured when they picked their plans. And 90 percent of the Medicaid enrollments via the state's exchange reported having been uninsured.
Obviously the "previously uninsured" rate will vary from state to state for both private exchange policies as well as new Medicaid enrollees, but the point is that these two states, which combined represent 24.1 million people (7.5% of the total population) reported a combined 62% previously uninsured rate for the private policies, and around an 83% combined uninsured rate for new Medicaid enrollees.
I should also note that when you add Kentucky and New York's 2014 numbers, those TWO STATES alone add up to nearly 260,000...the same number that Heritage claims were previously uninsured NATIONALLY.
Are they seriously saying that the "previously uninsured" rate for every other state in the country was basically 0% (to balance out the 62% for KY & NY)???
The increased enrollment in individual-market plans in 2014 equates to 40.6 percent growth in a single year for that market segment. By comparison, during the previous three years, total enrollment in individual-market plans was nearly flat, fluctuating narrowly around 12 million individuals.
Well, the Kaiser Family Foundation (one of the gold standards for this sort of thing) calculated the total individual insurance market to be around 15.6 million in 2014 vs. 10.6 million in 2013, but Heritage has the general range correct (15.6 = 47% higher than 10.6), so I'll give that a pass; different studies have slightly different methodologies and may produce slightly different results.
Now, however, we come to the meat of Heritage's claim:
For the fully insured employer-group market, the 2014 enrollment decline of 6.6 million persons equates to a single-year drop of 11 percent relative to 2013 enrollment of 60.6 million individuals. Before implementation of the ACA, total enrollment in fully insured employer plans had been gradually declining by about 2 percent per year.
The 2.1 million enrollees added to employer self-insured plans in 2014 constitute a 2 percent increase over the 2013 enrollment figure of 100.6 million individuals. By comparison, the average annual growth rate for this market segment during the three years prior to the implementation of the ACA was 2.8 percent.
Once again, I'll come back to that in a moment; let's finish up the Heritage post first:
The Department of Health and Human Services (HHS) reported that, as of the end of 2014, 6,337,860 people were covered by individual-market plans purchased through ACA exchanges. That figure is 1.5 million higher than the 4.7 million net enrollment increase for the total individual market (both on and off the exchanges). The difference most likely consists of people who already had individual-market coverage and purchased replacement plans through the exchanges. Some were likely forced to obtain new coverage by the discontinuation of prior plans that did not conform to the ACA insurance requirements, which also took effect in 2014, while others may have been induced to switch to exchange coverage by the availability of the new subsidies.
All of this is likely correct, more or less.
Two other data points are consistent with the explanation that a portion of 2014 exchange enrollments reflect a shift within the individual market from off-exchange plans to on-exchange plans.
First, the HHS data shows that 908,000 (or 14.3 percent) of individuals with exchange coverage did not qualify for subsidies. Because that means that they had relatively higher incomes, most of those individuals probably could have afforded pre-ACA individual-market coverage—particularly since those plans were generally less expensive than ACA-compliant ones—and it is likely that many of them had such prior coverage.
Second, for the individual market as a whole (both on and off the exchanges), enrollment increased by a net 4,795,768 individuals. But, for carriers offering coverage on the exchanges, enrollment increased by 5,270,318 individuals, while for carriers not offering exchange coverage, enrollment decreased by 474,550 individuals.[3] That also suggests that some individuals who previously had individual-market policies purchased replacement plans through the exchanges.
Again, likely correct: About a half-million people (myself included, I should note) did indeed switch from a non-compliant ACA individual policy over to an ACA exchange policy.
OK, I'll leave it there, but let's go back to Heritage's main claim: That a net of 4.5 million people lost their ESI coverage. IF this is true, it would indeed cancel out the vast bulk of the 4.8 million increase on the individual market. It would also mean that of the 6.3 million people still enrolled in exchange coverage as of the end of 2014, only about 4% of them were newly insured, with the other 96% having been shifted over from other types of coverage. But is it true?
Well, let's look at the evidence:
- According to a spring 2014 Kaiser Family Foundation, 57% of those who enrolled in private exchange policies for 2014 were previously uninsured. That would be roughly 4 million of the 7.1 million actually enrolled in the spring, and 3.6 million of those still enrolled as of the end of the year (I suppose it's conceivable that every single one of the 800K who dropped off between April and December were among the original 57%, which would bring the percentage down to around 51% or 3.2 million; the actual end-of-year number is likely somewhere in between; let's split the difference and call it 3.4 million). That's a hell of a lot more than 260,000 people.
- Perhaps Kaiser is way off base? Well, according to a similar survey by the Commonwealth Fund in spring 2015, the "previously uninsured" rate was a bit lower (out of a higher total number): 53% out of around 10 million people. That's around 5.3 million. Obviously some of those came from the 2015 open enrollment season, not 2014, but even if you assume a 50/50 split between the years, that'd still be over 10 times higher than the Heritage Foundation claims.
In other words, the only thing which makes the Heritage Foundation's "260,000" claim plausible is the alleged net loss of 4.5 million ESI policies in 2014, right? Where did that come from?
Well, according to Heritage:
For enrollment in self-insured employer plans we used the data reported by Mark Farrah Associates for plans administered by an insurance carrier. Mark Farrah compiles that data from insurer regulatory filings, supplemented by other public and private sources, such as Securities and Exchange Commission filings. While the firm’s data on the self-insured market is the most comprehensive available, there are no reliable figures for enrollment in self-insured plans that are administered by independent third-party administrators (TPAs)—that is, TPAs that are not a subsidiary of an insurance carrier. However, based on its research, Mark Farrah Associates believes that truly independent TPAs likely account for no more than 5 percent of the total self-insured market.[4]
OK, that's what Mark Farrah Associates says, "supplemented by other public and private sources".
However, here's what's interesting. In February 2015, the Urban Institute published a study on the expected impact of an adverse King v. Burwell ruling. In response, the Heritage Foundation posted a series of criticisms...spearheaded by one Edmund Haislmaier...otherwise known as one of the same co-authors as today's Heritage Foundation study.
The Urban Institute, in turn, published a response to each of Haislmaier's criticisms...and one portion should look very familiar:
The RAND analysis, consistent with ours, finds that a decision for the plaintiffs would “undermine the ACA’s current and future success in reducing the number of uninsured Americans, which dropped by an estimated 8 to 10 million during the first open enrollment period” (Saltzman and Eibner 2015). In response, Haislmaier [one of the authors of today's Heritage article as well] claims that 85 percent of the increase in nongroup insurance coverage under the ACA amounted to a crowding out of employer-sponsored insurance (ESI). In other words, he states that the vast majority of the increase in nongroup insurance coverage was offset by a decline in ESI. Consequently, he believes that reversing coverage gains via the ACA’s Marketplaces would not significantly affect the number uninsured, because he hypothesizes that almost 90 percent of the expansion of coverage under the law is attributable to the Medicaid expansion.
Yup. Haislmaier was making the exact same claim back in February...except he's taken it even farther; back then he was claiming 90% of the net gain was from Medicaid; today he claims it's up to over 97%. However...
His interpretation of the changes in ESI coverage between 2013, 2014, and 2015 are, however, inconsistent with the broad array of research evidence. His misinterpretation is likely the consequence of using multiple datasets that measure insurance coverage from different sources differently, resulting in an inconsistent understanding of coverage dynamics overall. The data source he uses for fully insured employer coverage is a different one from what he uses for a source of data on self-insured employer coverage. Consequently, he may well be missing a movement from fully insured to self-insured products. In addition, the data sources he uses are plagued by problems of large insurers with many enrollees not appearing in the data consistently over time, with the coverage continuing but not always captured by the data (Blewett et al. 2014).
Available evidence from consistent sources of data through 2014 demonstrates that ESI has remained stable in the early years of ACA implementation. A study by the Urban Institute found no significant changes in ESI offer rates, take-up, and coverage between June 2013 and September 2014 for all workers, workers in small firms, or low-income workers (Blavin, Shartzer, and Holahan 2015). Additional estimates from the Urban Institute show no change in employer offer rates, take-up, or coverage and a significant decline in uninsurance for nonelderly adults in FFM/partnership states with family income in the range targeted by Marketplace subsidies between September 2013 and December 2014 (figure 1). Similarly, data from Gallup show ESI held relatively steady for nonelderly adults between quarter 3 2013 and quarter 4 2014 (44.4 percent compared with 43.4 percent, respectively), with a 5.7 percentage-point decline in the uninsured rate and increases in nongroup insurance (which Gallup refers to as “self-paid”), Medicaid, and Medicare.2 Estimates from the National Health Interview Survey show an overall increase from quarter 4 2013 to quarter 2 2014 in the share of the nonelderly population with any private coverage from 60.5 to 63.8 percent, including ESI and directly purchased coverage (National Health Interview Survey Early Release Program 2014).
That's not all. According to the Agency for Healthcare Research & Quality's Medical Expenditure Panel Survey from June 2015:
Covered employees:
The number of employees who enrolled in a health insurance plan through their private-sector employer was stable between 2013 (56.3 million) and 2014 (55.8 million). The percentage of enrollees in single coverage increased from 51.3 percent in 2013 to 52.4 percent in 2014. The percentage of enrollees in employee-plus-one coverage declined from 18.9 percent in 2013 to 18.3 percent in 2014. The percentage of enrollees in family coverage did not change between 2013 and 2014 (29.8 percent and 29.3 percent, respectively) (data not shown).
Stable. Yes, a very slight drop of around 500,000...but nowhere near 4.5 million, and 500K is well within any reasonable margin of error when you're talking about numbers this large.
How about the U.S. Census Bureau? Well, according to them:
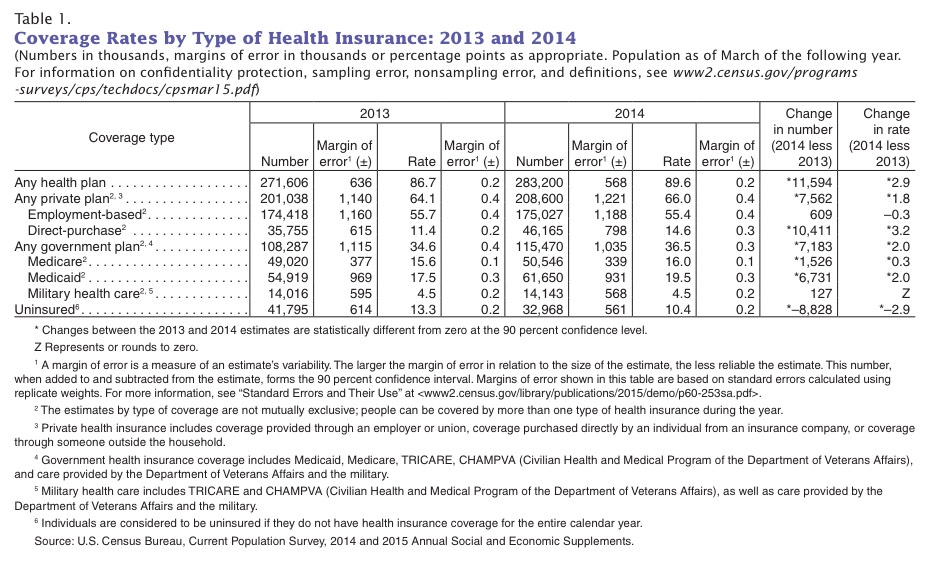
Well, will you look at that? According to the U.S. Census Bureau, in 2013, 174.4 million people had some form of Employment-based coverage; in 2014 this increased slightly to 175 million. The numbers are dramatically higher than the prior study because, as noted in footnote 2, "The estimates by type of coverage are not mutually exclusive; people can be covered by more than one type of health insurance during the year."
The larger point, however, is that there seems to be substantial evidence from a variety of reputable sources that Employer Sponsored Insurance did not drop noticeably between 2013 and 2014. (And why would it anyway? The ACA’s employer mandate wouldn’t kick in for another year.)
In fact, the only source they provide is their claim of subscription-only data from Mark Farrah Associates "supplemented by other public and private sources". Without actually having the source data available, they're asking people to take their word for it (and no, I'm not asking them to flood me with a mountain of insurance filings).
Let's look at it another way, however: The only way for Heritage's claim to be true would be if only 4% of the 2014 Exchange enrollees were previously uninsured.
258,000 people out of 6.3 million people still enrolled as of December 2014 would be just 4.1%. If you count it against the 7 million who were enrolled earlier in the year, that's only 3.7%.
Does that sound even remotely plausible? Especially given that even Avik Roy and Megan Mcardle were willing to concede at least a 27% "previously uninsured" rate last year?
When you have data which sounds reasonable and is supported by substantial evidence on one side, and you have absurd-sounding data on the other, supported only by hidden data and presented by an extremely hostile source, a reasonable person will lean towards the former.
How about in 2015? Well, the unemployment rate has continued to drop this year, which is obviously likely to increase ESI coverage (or at the very least, to counterbalance any drop in ESI coverage for current employees). This is one of the main reasons why both the HHS Dept. and myself are projecting dramatically lower exchange enrollment numbers for next year.
The irony of all of this is that yes, most of the net coverage increase is due to Medicaid Expansion...just not nearly as much as the Heritage Foundation has strained to prove. Instead of a 97/3 ratio, it's almost certainly more like a 2:1 split:
- For all of 2014: Roughly 6 million via Medicaid, 3 million via exchange QHPs, assorted via SHOP/sub26ers on parents' plans thru ESI, etc.
- For the first half of 2015: Roughly 11 million via Medicaid, 5 million via exchange QHPs, 1 million via SHOP/sub26ers on parents plans thru ESI, etc.
If Mr. Haislmaier had simply stuck with that ratio instead of trying to claim an absurdly lopsided 97/3 split, the rest of his point about the "evils" of "socialized medicine" would still be just as valid (or not).
Instead, he exaggerated his point so much that it became easy pickings.
UPDATE: More from Matthew Martin, aka Hyperplanes here:
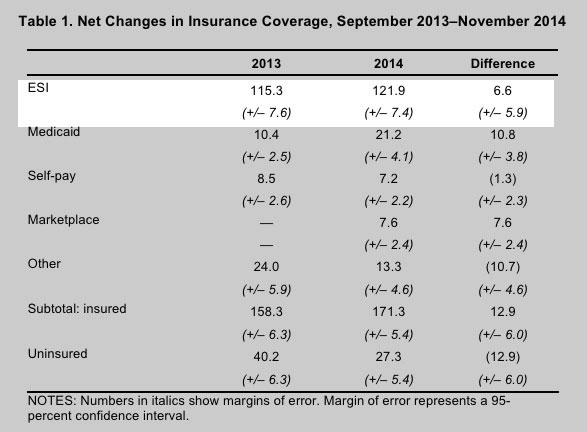
I was reminded of the on-going RAND health insurance surveys, so I looked up their survey that covers the September 2013-November 2014 period, which should roughly line up with Heritage's numbers. They actually found that almost as many uninsured people gained ESI as signed up for Medicaid—7.3 million to 7.5 million respectively. There's plenty of churn though, so counting those who lost ESI, they found a net increase in ESI of 6.6 million, way different than Heritage's -4.5 million. In fact, the gross number of those losing ESI in the RAND data was just 3.4 million, on the same order as Heritage's net figure. The final sentence in RAND's abstract might as well be a direct rebuttal to Heritage:
These findings suggest that the ACA is expanding coverage through a variety of insurance sources, perhaps because the individual mandate is encouraging people to take up insurance offers that they might otherwise have declined.
Now, the two datasets are looking at slightly different windows—Heritage is looking at, supposedly, January 2014 through December 2014, while the RAND data starts a few months earlier and ends one month sooner. But if what Heritage found is that more than 10 million people lost ESI in December alone—wiping out years worth of gains—they should do a better job writing up their findings!
Here's the table he's referring to:
Advertisement
