

Pop Quiz: Is the "average rate hike" 8%, 12%, 15% or 20%? Answer: All of the above!
Mon, 06/06/2016 - 4:32pm
As regular readers know, I'm currently in the thick of my state-by-state analysis of the requested, weighted average rate changes for 2017 by insurance carriers for the entire ACA-compliant individual market. As of this writing, the overall average looks like it's just a hair over 20% across 28 states + DC.
Does the first sentence above include a lot of clarifiers? Yes, yes it does...and with good reason. I try to be very specific when I discuss this stuff, because it's very easy to get confused about what a given number is actually referring to.
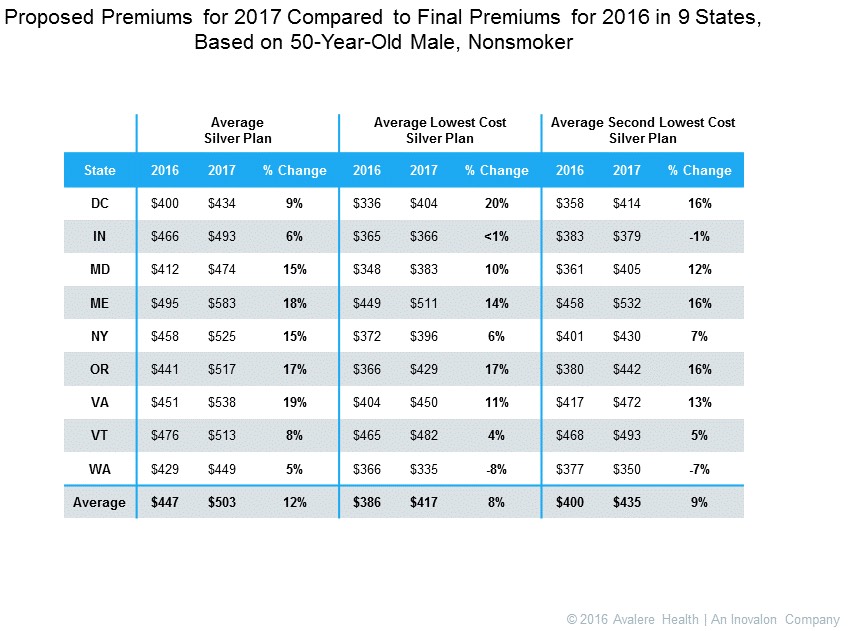
For instance, a few days ago, Avalere Health released their own analysis which concludes that the average requested/proposed premium rates are around 12%. If I left it at that, you might think that either my average is 8 percentage points too high...or that Avalere's is 8 points too low.
However, look at what Avalere is actually measuring (and they're quite up front and clear about this):
That's very different from simply saying "Avalere sez 12%", right?
- It only includes 8 states + DC, not the 28 (+DC) that I have, nor all 50 states +DC
- I think it only includes exchange-based plans (though I'm not 100% sure about that)
- The 12% figure only refers to the average Silver plan, not Bronze, Gold, Platinum or Catastrophic
- The actual dollar amounts used refer to a hypothetical 50-year old, non-smoking male
When you look only at the lowest-cost Silver plan above, it's only 8%; if you look at the 2nd lowest-cost Silver (which is what's used as the "benchmark" plan to determine federal tax subsidies for qualifying individuals), it's 9%, and so on. It's important to stress that Avalere isn't doing anything wrong here--they're not misleading anyone, they're completely upfront about what their analysis is measuring and why.
By the same token, my own project, while attempting to be more comprehensive, isn't necessarily any "more" or "less" accurate than Avalere's; it's just measuring something different, and I'm just as up front about what it does and doesn't include:
- It does (or hopefully will, when I'm done) include all 50 states + DC.
- It does include both on and off exchange policies, although...
- It doesn't include non-ACA compliant policies (ie, "grandfathered" or "transitional")
- It does include all metal level/catastrophic plans whereever possible
...and so on. There are some additional caveats and disclaimers, since some of the enrollment numbers are confusing/difficult to track down in the SERFF filings, while some of the "average rate change requests" can also have contradictory data (there are a few cases where RateReview.HealthCare.Gov will have one number, but the actual rate filing will claim a slightly different average, etc).
So why is Avalere "ignoring" the other tiers? Simple: As they note in their own analysis, 68% of on exchange enrollees select Silver plans. That means that most people enrolling on the ACA exchanges can expect to see a significantly lower average rate increase than everyone else on the individual market (and that's before any federal tax credits are applied). This is a valid point to make.
At the same time, it's also useful to look at the entire individual market (again, ACA-compliant only, since both grandfathered and transitional policies belong to separate risk pools, and both of those should have dwindled away into rounding-error numbers within another year or so anyway. That's what my analysis measures.
A second, very common source of confusion can occur when it comes to on exchange vs. off exchange policies. Let's consider the state of Nevada.
The same day Avalere posted their analysis, I also posted my "total ACA-compliant indy market" look at Nevada, and came up with a weighted average requested increase of 15.0% for the state:
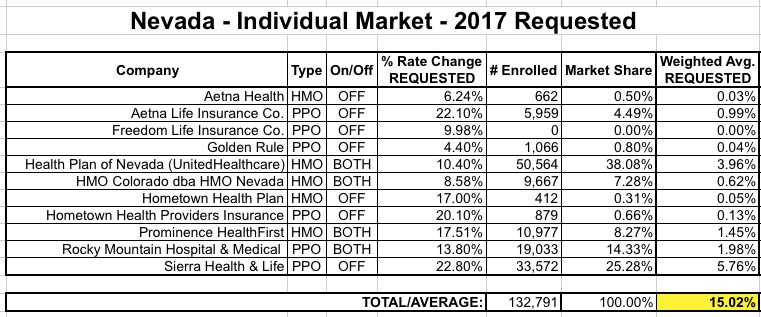
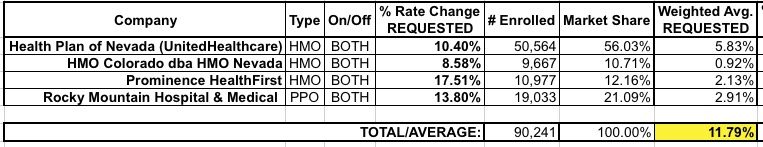
However, if you were to ask the Silver State Health Insurance Exchange itself (that's the name for NV's ACA exchange, which is still running even though the tech platform has been taken over by HealthCare.Gov), they would tell you that the weighted average requested rate hike for all exchange policies in Nevada is less than 12%. Here's why: While 11 carriers offer individual policies off of the exchanges, only 4 of those offer them on the exchange in Nevada. When you look at only those carriers, the average drops dramatically:
Again, no one is trying pull a fast one here--both the 15% and the 11.8% figures are equally accurate (and of course, could prove totally obsolete after the approved rates come out). They're just measuring different things, which are each valid points depending on what your perspective is.
So, to summarize:
- Avg. requested hike for Nevada, individual exchange plans: 11.8%
- Avg. requested hike for Nevada, all individual plans: 15.0%
- Avg. requested hike for 8 states +DC, lowest-cost Silver plans, on exchange only (?): 8% (for 50-year old nonsmoker)
- Avg. requested hike for 8 states +DC, all Silver plans, on exchange only (?): 12% (for 50-year old nonsmoker)
- Avg. requested hike for 28 states +DC, both on & off exchange, all metal levels: 20.1%
The larger point is, as always, to read the clarifiers, disclaimers and caveats carefully before jumping to any conclusions!
Advertisement
