

Massachusetts: REVISED avg. REQUESTED 2017 rate hikes: 6.7% (was 10.4%)
Mon, 08/22/2016 - 1:54pm
(sigh) Here's a good example of what a royal pain in the ass trying to estimate the annual rate change filings can be. Just 2 weeks ago, I was finally able to plug in the requested 2017 rate hikes requested by just about every carrier offering individual policies in Massachusetts, filling in one of the final blank states in my 2017 rate hike project.
This was a double headache: First, because the actual enrollment numbers were only available for 3 out of 11 carriers via the filings; I had to get the rest from the MA exchange's monthly dashboard report. Secondly, even with the dashboard report, I had to merge together 2 different enrollment numbers for each carrier due to MA's unique "ConnectorCare" program.
Finally, Massachusetts (along with Vermont and DC) has one other twist: They combine the risk pools for both the individual and small group markets...which is an excellent idea for every state IMHO. This means that unlike most states, in Massachusetts I have to combine the small group enrollment numbers with the individual market to get the overall weighted average rate changes. Unfortunately, I didn't have the full picture when I first ran these numbers 2 weeks ago--I only had on-exchange enrollment data. I assumed I was capturing the bulk of the market but had no idea how much the missing enrollees might skew those averages. In addition, when I originally ran the numbers, I didn't add the small group folks into the mix since I didn't do so for Vermont or DC; I wanted to be consistent.
Still, I did my best and came up with the following:
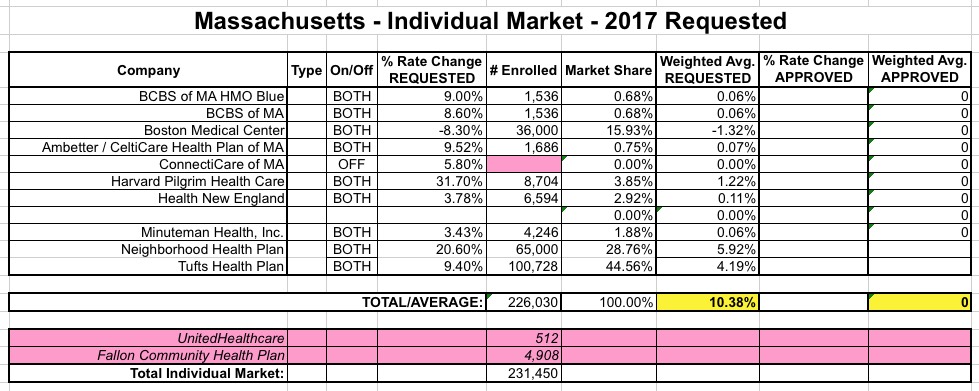
A 10.4% average actually isn't bad at all for 2017 (relatively speaking). However, earlier today I received more comprehensive, up to date data which is...completely different in a bunch of different ways. This information comes directly from the Massachusetts Dept. of Insurance. Enrollment numbers are completely different for most of the carriers...which makes sense given that the off-exchange market wasn't included previously. In addition, though, many of th erate hike requests are quite different as well, presumably due to re-submitted filings which just came in within the past week or so (?). Finally, while my prior information indicated that Fallon Community is bailing on the individual market in MA, I've been reassured that this isn't the case after all; apparently they'll be around (and on the exchange) next year after all.
In addition to all of that, the new data includes exact enrollment data for the small group market, which allows me to either include or not include it as I wish.
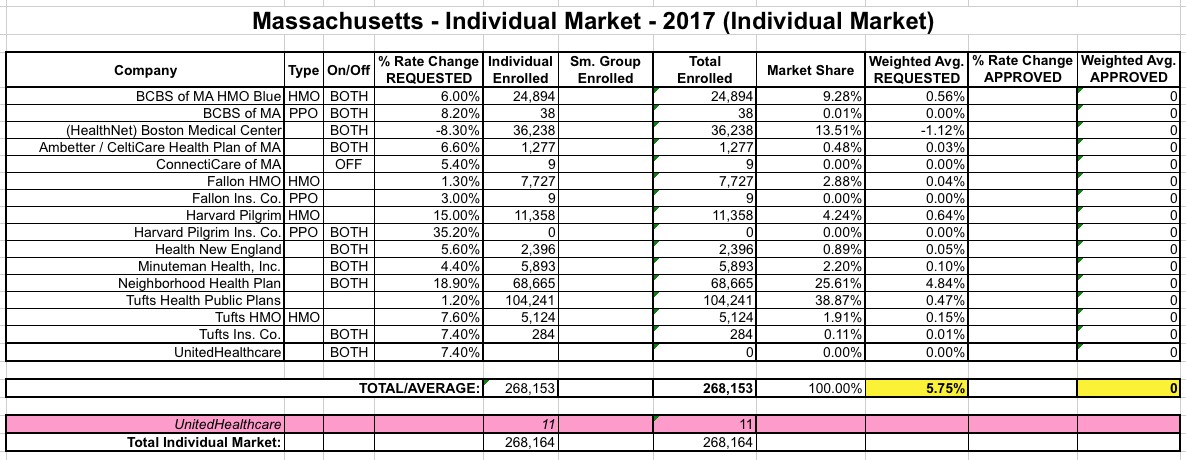
As a result of all of these changes and updates, my revised spreadsheet looks very different. Unlike a few other states which have had recent updates, however, Massachusett's requested average rate hikes are lower than I had previously estimated. Here's what it looks like with the individual market only:
...and, just for completeness, here's what it looks like with the small group market mixed in (remember, you can only do this in MA, VT and DC):
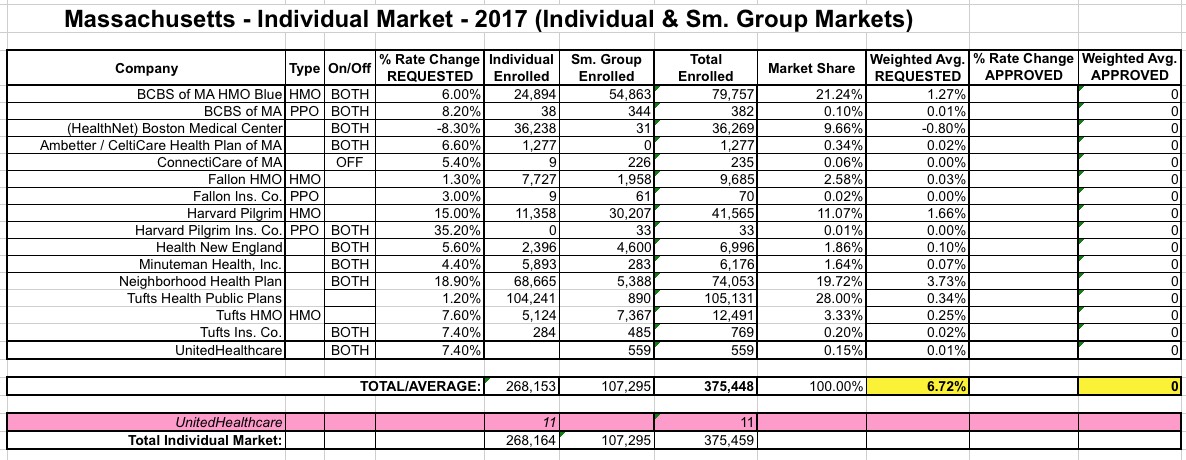
Either way, the statewide average has dropped dramatically...and again, these are the requested rate changes; the approved ones could be lower (or higher) in some cases.
Now, to be consistent with the other 49 states + DC, I should use the first table above (5.8%), since it only includes the individual market. However, given all the uncertainty, and in the interest of erring on the side of caution, I'm gonna use the higher average of 6.7%. Again, this is still several percentage points lower than I had previously thought, so it's (relatively) good news regardless.
Advertisement
