

REMINDER: That 25% only applies to the UNSUBSIDIZED INDIVIDUAL market, not EMPLOYER coverage!
Mon, 09/26/2016 - 1:42pm
UPDATE 10/26/16: In light of yesterday's official confirmation by the HHS Dept. that my estimate of ~25% weighted avg unsubsidized rate hikes on the individual market was dead-on target, I thought it was important to pin this entry to the front of the website again.
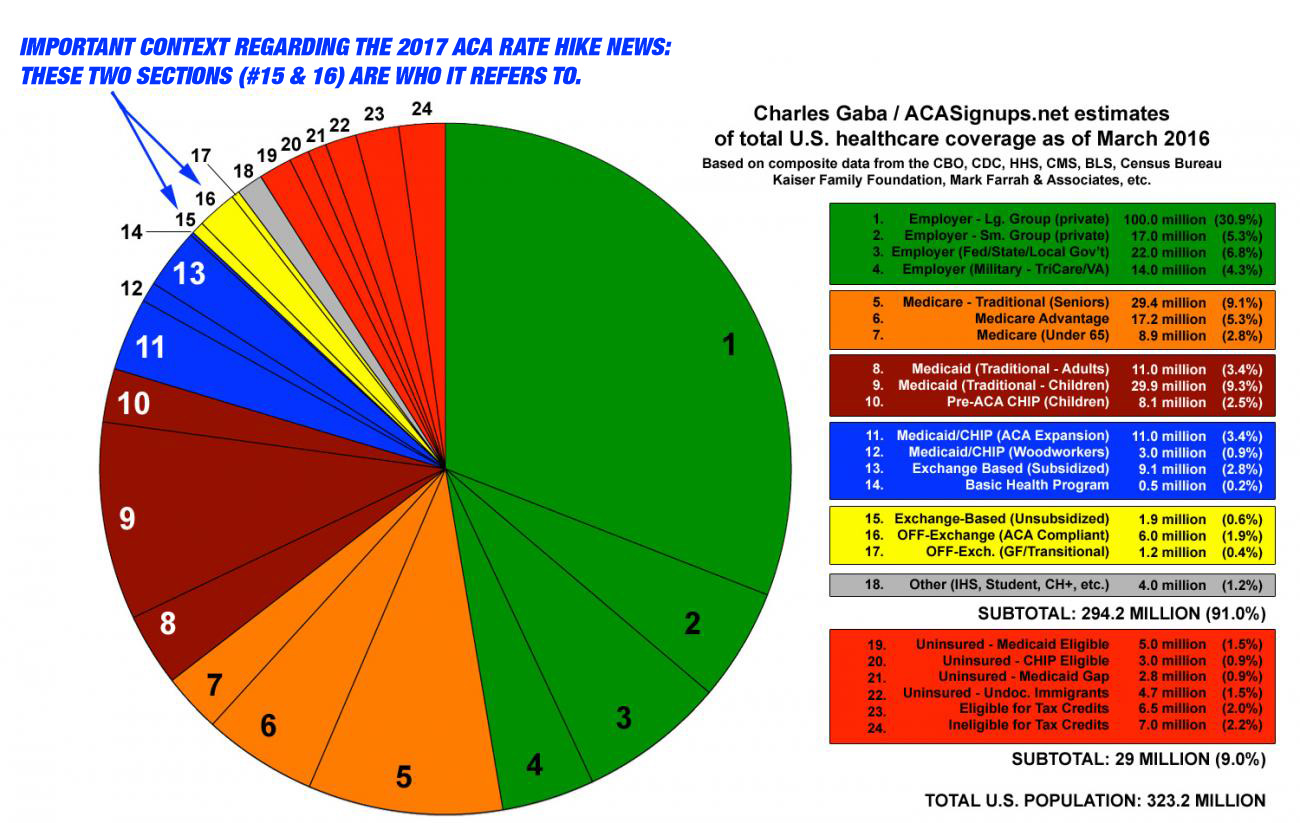
Remember that big pie chart I posted last March which broke out the entire U.S. population by type of healthcare coverage? Well, here's a modified version, showing which people will and won't be impacted by the "25% average" figure being argued about today:
I actually included most of this as an update to my last post, but given how important this is, I figured I should write it up as a separate entry.
A few people have asked whether or not the "25% average hikes" I've estimated which have been cited by pretty much every outlet under the sun also apply to job-based coverage.
NO! Absolutely not!
That 25% weighted national average only applies to the roughly 18 million people enrolled in ACA-compliant individual policies...and even then, roughly half of those folks are mostly protected from the hikes thanks to the federal tax credits. So we're really talking about roughly 9 million people who have to pay the full 25% average increases.
Don't get me wrong...that does suck for those 9 million people; I'm not trying to minimize their concerns. Hell, depending on my income from year to year, I'm occasionally among them (my wife and I are both self-employed and have a highly variable income). Having said that, 9 million people = around 2.8% of the total population.
OK, so what is the expected average rate increase for employor-sponsored healthcare policies? Well, according to the Kaiser Family Foundation, for 2016, ESI premiums only went up about 3%. So how about next year? Well, for 2017, this Fortune article from August says:
Employers’ costs of providing health benefits are expected to go up by about 6% next year while employees should expect about a 5% increase in their monthly premiums, according to a new survey by the National Business Group on Health (NBGH). The nonprofit organization is made up of 425 large employers and the survey contains data from 133 of these big businesses, which employ and sponsor health benefits to more than 15 million Americans.
OK, so that's around 5-6% for the large group market, which provides coverage to a good 40% or so of the total population.
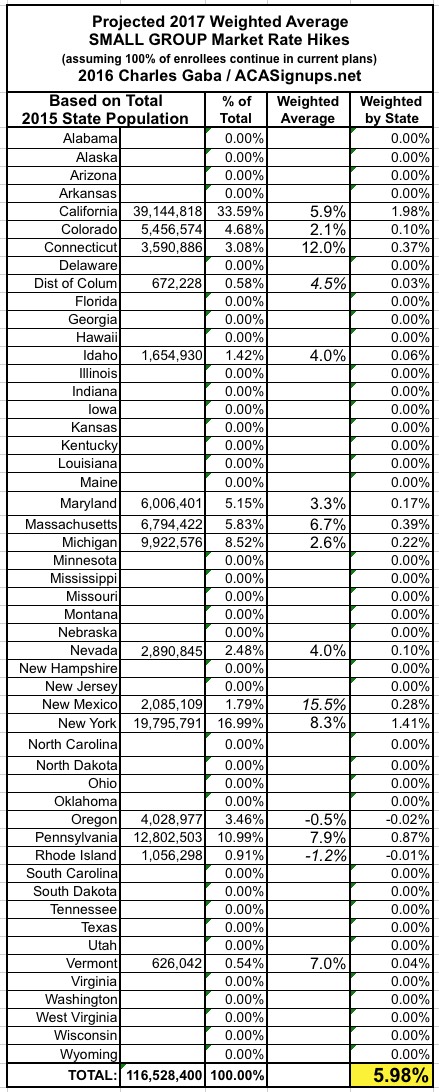
How about the small group market (around 13.5 million people, according to Mark Farrah Associates)? Well, I haven't run the full data for all 50 states the way I have for the individual market, but I do have either hard numbers (or rough estimates) for 15 of them so far:
- California: 5.9% approved
- Colorado: 2.1% approved
- Connecticut: 12.0% approved
- District of Columbia: Requested range from (-5.6%) to +14.6% (median: +4.5%)
- Idaho: 4.0% approved
- Maryland: 3.3% approved
- Massachusetts: 6.7% requested (MA combines indy & sm. group risk pools)
- Michigan: 2.6% requested
- Nevada: 4.0% requested
- New Mexico: Requested range from 0.5% to 31.6% (median: 15.5%)
- New York: 8.3% approved
- Oregon: (-0.5%) approved
Pennsylvania: Requested range from (-3.8%) to +33.0% (median: 14.6%)- UPDATE: Pennsylvania: 7.9% requested
- Rhode Island: Approved range from (-3.4%) to +1.1% (median: -1.2%)
- Vermont: 7.0% approved (VT combines indy & sm. group risk pools)
...for an rough overall weighted average (by total population of these states, or around 36% of the country) of around 6.0%. Note that several of the states list the median hike, not the average, so this is an imperfect estimate. In addition, obviously the remaining states could shift the sm. group average up or down, but it's pretty clear that this is much more stable than the individual market. So around 6% seems to be what we can expect in the total employer-provided market, which covers nearly half the country. Not fantastic, but much lower than 25%.
Advertisement
