

The Graph: Minor (but important) update: Adjusting for weekend shift
Tue, 12/13/2016 - 11:25am
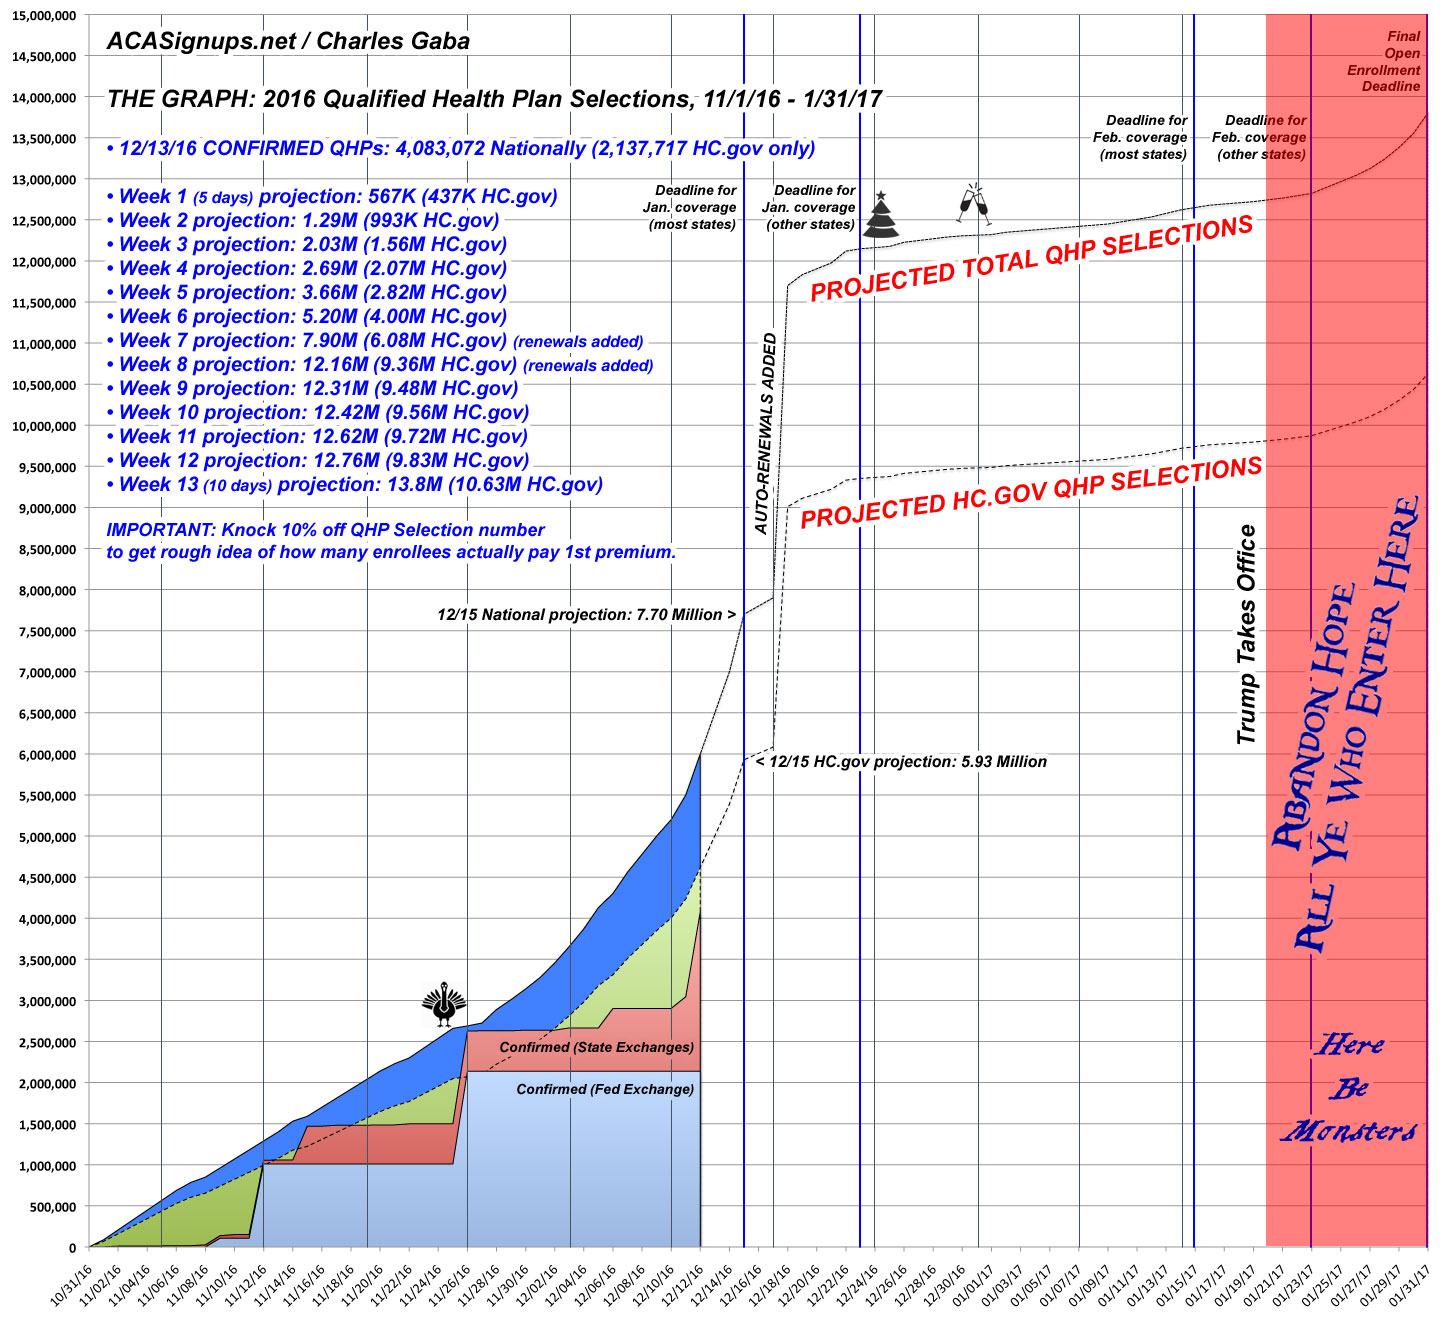
Careful readers might notice a subtle but important change in The Graph today. Most of the key numbers (including both my 12/15 and 1/31 projections) remain the same (7.7 million and 13.8 million respectively), and the overall flow of the projection curve hasn't changed. However, there's a pretty obvious difference right in the middle of the graph...namely the current week (Week 7).
The previous version had my projections as follows:
- 12/10: 5.38M national / 4.14M HC.gov
- 12/11: 5.62M national / 4.33M HC.gov
- 12/12: 6.00M national / 4.62M HC.gov
- 12/13: 6.17M national / 4.75M HC.gov
- 12/14: 7.00M national / 5.39M HC.gov
- 12/15: 7.70M national / 5.93M HC.gov
- 12/16: 8.15M national / 6.28M HC.gov
- 12/17: 8.56M national / 6.59M HC.gov
The revised estimate/projection is:
- 12/10: 5.20M national / 4.00M HC.gov
- 12/11: 5.50M national / 4.25M HC.gov
- 12/12: 6.00M national / 4.60M HC.gov
- 12/13: 6.50M national / 5.00M HC.gov
- 12/14: 7.00M national / 5.39M HC.gov
- 12/15: 7.70M national / 5.93M HC.gov
- 12/16: 7.80M national / 6.00M HC.gov
- 12/17: 7.90M national / 6.08M HC.gov
...after which the projections revert back to where I already had them (12.16 million as of Christmas Eve, etc.)
There's a simple reason for this: When I whipped up this year's Graph, I forgot to take into account that November 1st fell on a Tuesday this year instead of a Sunday. Since enrollments tend to drop off substantially on weekends, this means that the slowdown comes 2 days earlier each week. For most weeks this is barely visible on the Graph, but this week in particular it can make a huge difference...up to a couple hundred thousand people per day.
In addition, normally CMS officially adds several million auto-renewals in a big lump sum around December 17-18th. Since those dates also fall over the weekend this year, I'm assuming they'll all be plugged in at once on Monday the 19th, resulting in an even more dramatic vertical line shooting up on that date.
With these tweaks in mind, here's what The Graph now looks like. Again, I haven't changed my key deadline projections, just the day-to-day flow within the current week or so.
CMS should be releasing their Snapshot Report for Weeks 5 and 6 tomorrow; with this revision, I now expect that report to show roughly 4.0 million QHP selections across the HC.gov states as of 12/10/16.
Advertisement
