

UPDATE: Tom Price/CMS release more "ACA Sux!" data which is partly true, partly nonsense and partly meaningless
Mon, 07/10/2017 - 4:39pm
In the latest "ACA Sux" propaganda blitz being carried out by Tom Price's HHS Dept, a press release came out today claiming that:
Fewer issuers apply to participate in Health Insurance Exchanges for 2018
Fewer issuers apply to participate in Health Insurance Exchanges for 2018
Less choice for consumers as issuer health plan applications drop 38 percent from last yearThe Centers for Medicare & Medicaid Services (CMS) today announced 141 individual market qualified health plan (QHP) issuers submitted initial applications to offer coverage using the Federally-facilitated Exchange eligibility and enrollment platform in 2018. At the initial filing deadline last year, 227 issuers submitted an application compared to 141 this year, a 38 percent drop in filings.
...At the beginning of the open enrollment period for 2017 coverage, issuer participation had fallen from 227 initial applicants to only 167 issuers actually participating, a drop of 26 percent. Each participating issuer is required to sign a final QHP contract by the end of September in order participate in the Exchange in 2018.
Submissions were made by issuers in the 39 states that use the Federal Exchange eligibility and enrollment platform. CMS expects this number to fluctuate over the next several months as it has in past years. Rates will be finalized by mid-August.
- Date: Initial / Final
- PY 2016: 281 / 237
- PY 2017: 227 / 167
- PY 2018: 141 / TBD
OK. First of all, yes, this is probably accurate: There has been a significant dropoff in the number of carriers participating on the ACA exchanges over the past few years. This is not exactly a big surprise.
However, there's also an awful lot of data missing from the picture. Notice that they don't include 2014 or 2015. Why not? Well, perhaps because when you do, the picture changes a bit.
In 2014 and 2015, there were 257 and 319 carriers respectively across 44 states + DC. For an apples to apples comparison, I need to first add the missing states for the later years (CA, CO, CT, DC, ID, MD, MN, NY, RI & WA)...and then subtract 4 of the states which aren't included at the link above but are on the federal exchange this year (HI, KY, NV & OR).
Alternately, I could remove the 10 states not included at the link above, which would bring 2014 down to 187, and 2015 down to 243...but only for 35 states. I'd then have to add back in HI, KY, NV and OR. Alternately, I'd have to add the other 10 states back into the latter 3 years.
Since that'd be a royal pain to hunt down, how about using the average number of carriers per state? Crude but best I can do for the moment:
- 2014: 187 carriers across 35 states (5.3 per state)
- 2015: 243 carriers across 35 states (6.9 per state)
- 2016: 237 carriers across 39 states (6.1 per state)
- 2017: 167 carriers across 39 states (4.3 per state)
- 2018: (assuming 141 across 39 states?) (3.6 per state)
Of course, some of the missing states have wildly different demographics, economies and populations, so I'm not sure that this is any more "accurate" a picture...but assuming it is, what you see is that the number of carriers expanded dramatically from 2014 to 2015 before starting to drop off again each year after that.
However, this also means that assuming an average of 3.6 carriers per state next year, the actual dropoff from the first year of the exchanges will only be down around 1/3 overall. This isn't a good thing, but it's far less dramatic than the 50% dropoff suggested by the CMS press release (141 submitted in 2018 vs 281 in 2016).
I should also note that, as Hannah Recht mentioned via Twitter earlier, given the absurd number of subsidiaries, rebrandings, mergers and acquisitions which take place in the health insurance market, it's entirely possible that some of the numeric changes are simply two "carriers" being absorbed into one (or, admittedly, a single parent company deciding to operate under two different brands the next year). David Anderson of Balloon Juice says that according to his analysis, the federal exchange (HC.gov) had 183 "HIOS" listings in 2014, 212 in 2015, 232 in 2016 and 165 this year...but again, that's complicated by the fact that a handful of states have moved from their own exchange to the federal one each subsequent year (Oregon and Nevada in 2015; Hawaii in 2016; and Kentucky in 2017), while one state (Idaho) moved off the federal exchange onto its' own platform.
The next question is what caused that drop? Well, there's a lot of reasons, some of which can indeed be connected to some inherent flaws in the ACA itself, such as the 400% APTC cut-off threshold, the "skinny plan" glitch and the "family glitch". Some of it is due, no doubt, to the decision by about 2/3 of the states to allow transitional plans to be "grandmothered" in from 2013 (the responsiblity for this falls partly on President Obama for allowing the extension, partly for state regulators for giving carriers the option to do so...and now, partly on HHS Sec. Tom Price for extending the transtional allowance by another year).
However, a big part of the drop-off, especially from 2015 to 2016, can be connected directly to the Risk Corridor Massacre, masterminded by Marco Rubio in December 2014 but not actually being triggered until late summer 2015. This utterly unnecessary bit of deliberate sabotage contributed greatly to the destruction of at least a dozen insurance carriers (eventually almost 20 of them), mostly including ACA-created co-ops but also including a couple of small private carriers.
The drop-off got worse last year as another half-dozen co-ops folded (again, partly due to the Risk Corridor Massacre fallout), but mainly because the Big Three (UnitedHealthcare, Aetna and Humana) all decided to shrink their footprint dramatically. In most cases they were indeed losing money on the individual market (although they were making fat profits elsewhere)...but in at least two cases, Aetna dropped out of the market even when they were making a profit in it, for reasons entirely unrelated to the actual strength of the ACA market.
For 2018, the dropoff will likely indeed continue apace...but again, many of the carriers are being very specific about the REASON why they're dropping out (or why they may do so)...namely, THE TRUMP ADMINISTRATION'S ONGOING THREATS TO CUT OFF COST SHARING REDUCTION PAYMENTS AND/OR NOT TO ENFORCE THE INDIVIDUAL MANDATE.
How many times does this point have to be stressed and explained? Yes, many carriers are indeed dropping out of the individual market...but they're doing so in large part because of Donald Trump, Tom Price and Congressional Republicans deliberately sabotaging that market.
Now, this doesn't explain every carrier dropping out; I'm sure there's a few which would be doing so anyway, just as there are also some carriers expanding their participation in the ACA exchange individual market even with the CSR/mandate enforcement uncertainty. For the most part, however, numerous carriers have listed those factors as primary reasons why they've either already bailed or may still do so.
In short, the GOP set the house on fire and is now criticizing people for running out of the house.
In short, I've taken Sec. Price's grossly misleading tweet/graph...
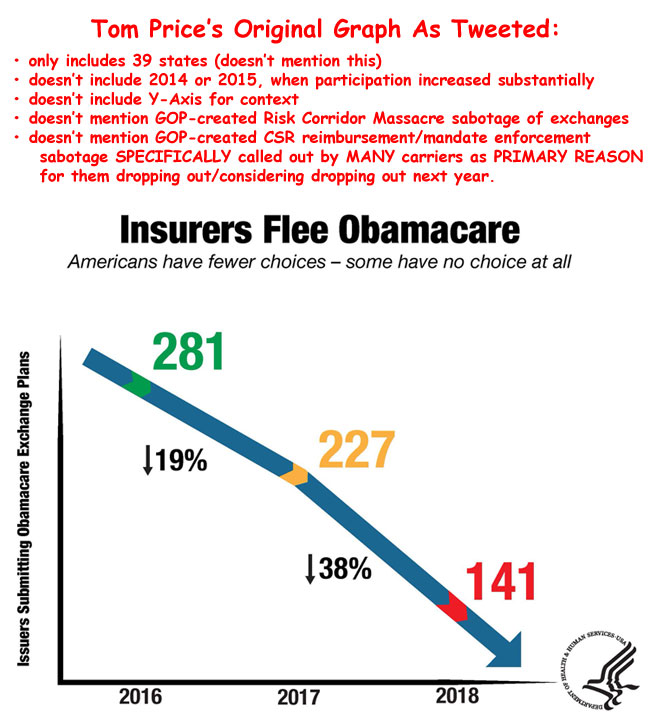
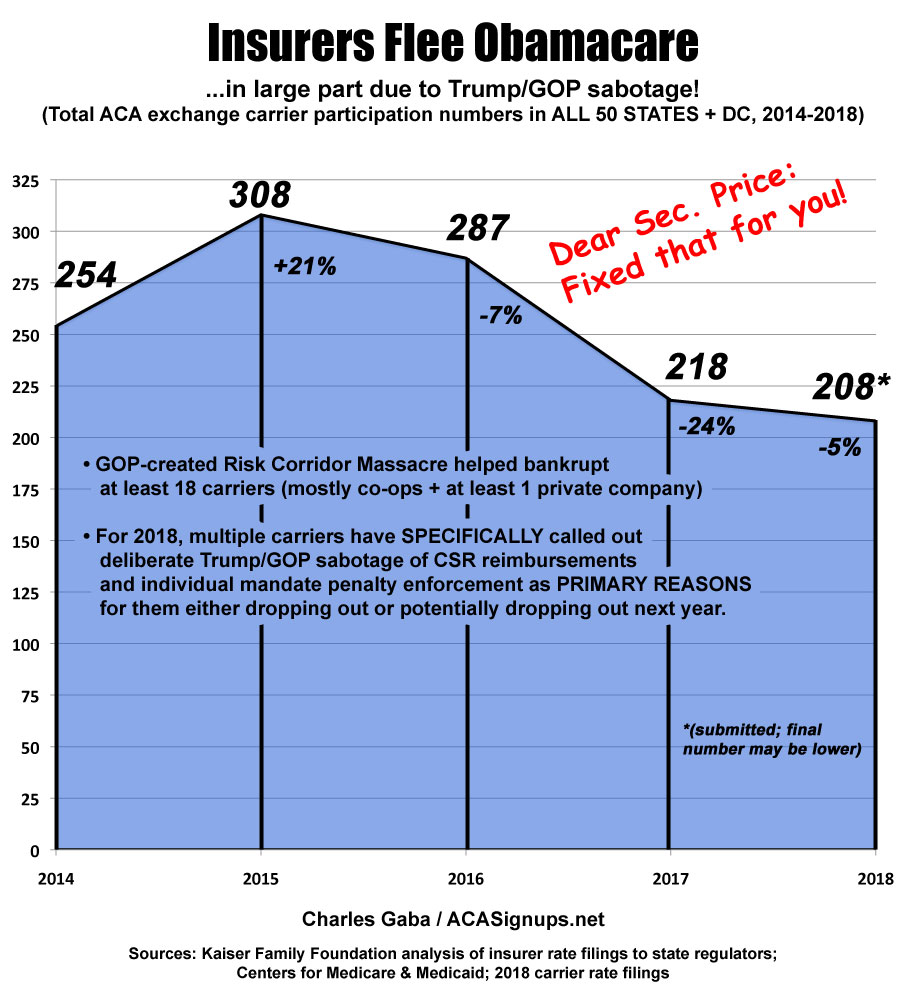
...and completed/corrected it below:
UPDATE: OK, thanks to David Anderson, Hannah Recht and Louise Norris for helping me out, and especially to the Kaiser Family Foundation which made it easy to fill in the blanks for 4 of the 5 years!
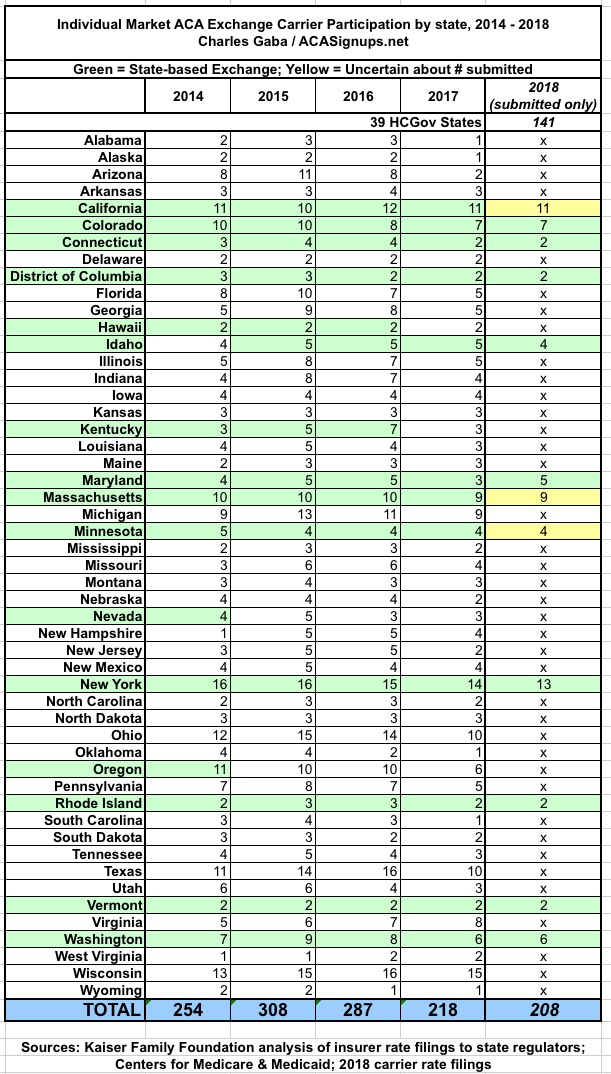
Here's what it actually looks like...with a complete and corrected graph (I'm not certain about the 2018 submission totals in the 4 yellow cells):
UPDATE: Thanks to the National Academy for State Health Policy for clarifying a few of the 2018 states...a couple of states lost or gained one carrier, but the total still ends up the same (208):
Advertisement
