

UPDATE: Gallup: 3.2 million adults have lost coverage since Trump took office
Tue, 01/16/2018 - 10:03am
Every quarter, Gallup posts the results of an exhaustive healthcare coverage survey (with over 25,000 U.S. adults). They just posted the latest update, which covers the fourth quarter of 2017, and the results are...striking.
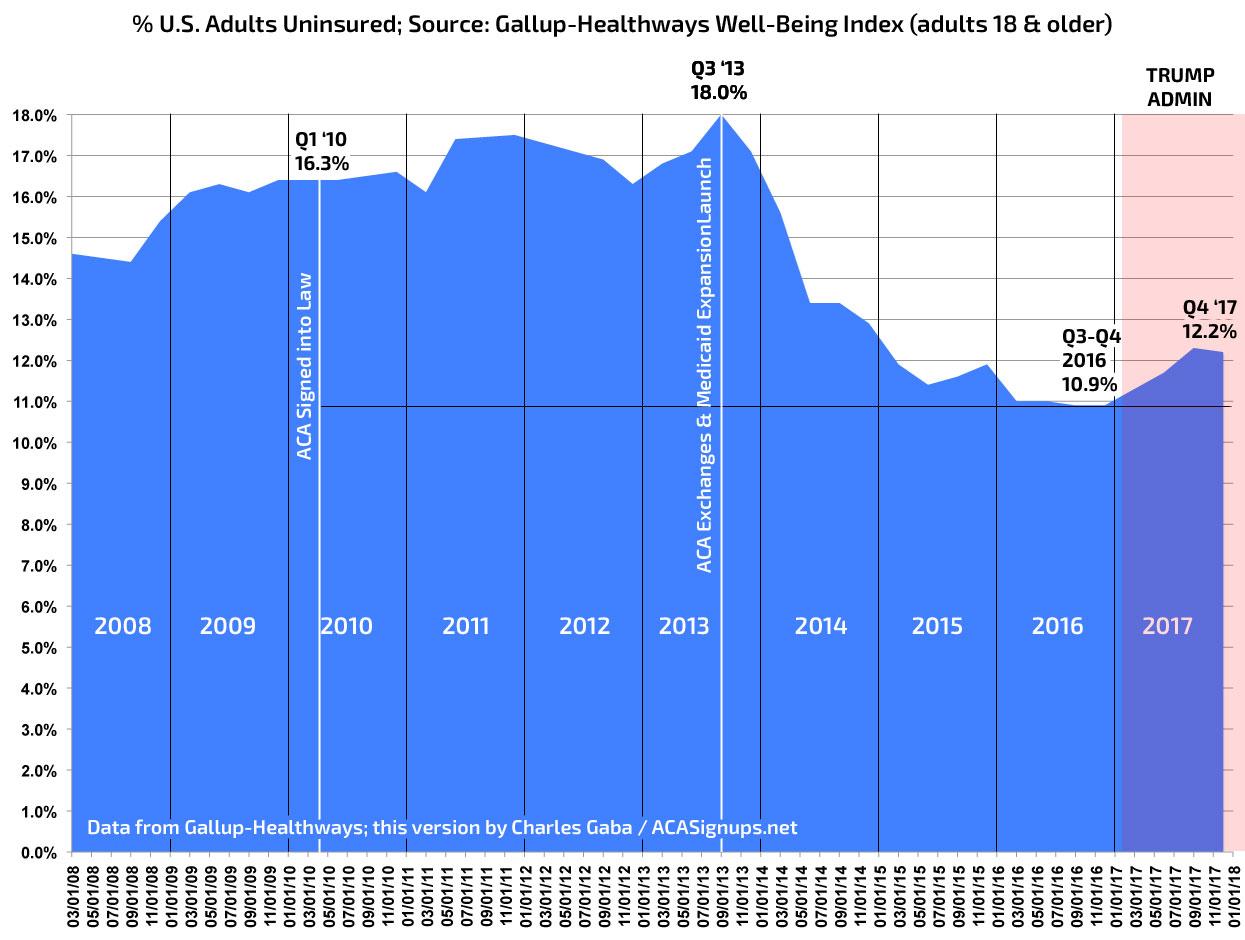
Gallup has a rather annoying habit of not including the full Y-axis in their charts, so I've reformatted their quarterly survey results into a fuller version, noting a couple of key dates. The most obvious takeaway:
- The U.S. uninsured rate among adults, which had reached 18% just before the major Affordable Care Act provisions (individual market exchanges and Medicaid expansion) kicked into effect, reached an all-time low of 10.9% last winter...
- ...only to reverse the trend since then, climbing back up again over the first year of the Trump Administration to end 2017 at 12.2%.
One important thing to keep in mind is that Gallup's surveys only include adults over 18, which means they only include about 77% of the population. Since children tend to have a much lower uninsured rate than adults (thanks in large part to programs like Medicaid and CHIP), this skews the results for the total population by several percentage points.
Even so, with the total U.S. population standing at over 325 million as of last July, that's about 251 million adults over 18...which means that the 1.3 percentage point increase equates to a little over 3.2 million adults having lost their healthcare coverage in the first year of Trump's presidency.
As for who's lost their coverage, that's where things get a little confusing. I've been operating on the assumption that it would mostly be middle class people on the individual market, since they're the ones who have to pay the full (unsubsidized) price for their policies and were hit with a ~25% average rate increase in 2017. Gallup confirms that it's the individual market where the biggest coverage loss happened...but according to their survey, the demographics are different from what I expected:
The uninsured rate rose for all demographic groups in 2017, with the exception of those aged 65 and older, all of whom qualify for Medicare coverage. It increased most among young adults, blacks, Hispanics and low-income Americans.
Importantly, the uninsured rate among adults aged 18-25 rose by 2.0 points in 2017. Young adults serve a critical function in healthcare markets because their low usage of healthcare helps offset the higher costs of insuring older Americans.
I'm not surprised by the Young Adults stat, and the ethnic data doesn't tell me much, but I admit to being surprised to see the increase being higher among lower-income folks (2.0 points) instead of middle-class people (1.4 points).
However, there's one data point which I find very confusing:
Fewer Americans Bought Their Own Health Plans in 2017
Gallup and Sharecare also track the ways in which Americans aged 18 to 64 (those who are not eligible for Medicare) obtain their health insurance -- whether that be through an employer, union, the government or a direct purchase from an insurance company.
By far, the biggest change in 2017 was the decline in the percentage of Americans purchasing their own plans, likely through ACA healthcare exchanges....
OK, so far this makes perfect sense: Yes, the individual market is where you'd expect to see the biggest hit. HOWEVER, here's the confusing part:
In the last quarter of 2017, 20.3% of Americans said they bought their plan themselves, down 1.0 point from 21.3% at the end of 2016.
Huh???
Neither of these percentages make any sense whatsoever.
The individual major medical policy market has never been higher than around 20 million people nationally (including both the on & off exchange divisions), or perhaps 7% of the total U.S. population. Even if you account for children not being included (and some of the indy market is children), that's still no more than 8% at the outside. And yes, that includes "grandfathered" or "transitional" policies.
20-21% of the population, even limited to adults, would be around 50 million people...2.5 - 3x as many as have actually ever been enrolled in Indy Market plans.
The only explanation I can think of here is that a lot of people are completely misunderstanding the question about "purchasing their own plans". Perhaps some are confusing individual market policies with "mini-meds", "short term plans" and so on? They might be including "Christian sharing ministry plans"? Or perhaps some think that Medicare Advantage is "purchasing their own plan"?
Whatever the explanation, this ~20% data point makes no sense to me at all.
Anyway...
Other sources of health insurance remained largely unchanged in 2017, with the second-largest difference being a 0.6 point decrease in those receiving coverage through an employer.
This one really surprises me...with unemployment continuing to drop (or at worst holding steady) and the employer mandate still in effect, any drop in employer coverage doesn't make much sense to me. Also, the employer-sponsored insurance market is much larger than the individual market (around ~155 million vs. ~18 million or so a year ago), so a 0.6 percentage point drop should equate to around 720,000 people all by itself if you take children out of the picture.
Still, assuming the bulk of the other 2.5 million net loss is in the individual market (which I'm sure is the case), this also explains why I suspect that the actual repeal of the individual mandate starting in 2019 will have less of an impact by itself than the Congressional Budget Office projected. While that may sound like good news, it's not--because all it means is that other types of sabotage, undermining and confusion caused in large part by the Trump Administration and the Congressional GOP have already caused indy market enrollment to drop substantially...meaning there's that many fewer people left in it to lose their coverage in the future.
UPDATE: Thanks to commenter "M E" below who notes that while Gallup's survey in general includes all adults (i.e., anyone over 18 years old), the specific question about source of coverage is limited to 18-64 year olds only.
This brings the number being surveyed about their type of coverage down to around 201 million (62% of ~325 million). 20.3% of that is around 41 million people...which is a lot lower than 50 million, but still more than twice as high as the actual individual market size. The mystery remains.
Advertisement
