

New study projects ACA sabotage will cause up to ~25% rate hikes next year alone, up to 62% over next 3 years depending on the state
Thu, 03/08/2018 - 11:23am
Today, Covered California issued a new study about the projected impact of Donald Trump and Congressional Republican efforts to undermine and sabotage the Affordable Care Act not just in 2019, but over the next 3 years. They main focus is on two sabotage moves which have already happened (repeal of the individual mandate and the shortened/underfunded marketing of the open enrollment period on the federal exchange) and one which is on the verge of happening (Trump's "Short Term and Association Plan" executive order, aka #ShortAssPlans).
Here's what they concluded:
- Due to ongoing federal uncertainty, premium increases for every state could range from 12 to 32 percent in 2019.
- The cumulative premium increases from 2019 to 2021 could be between approximately 35 and 90 percent.
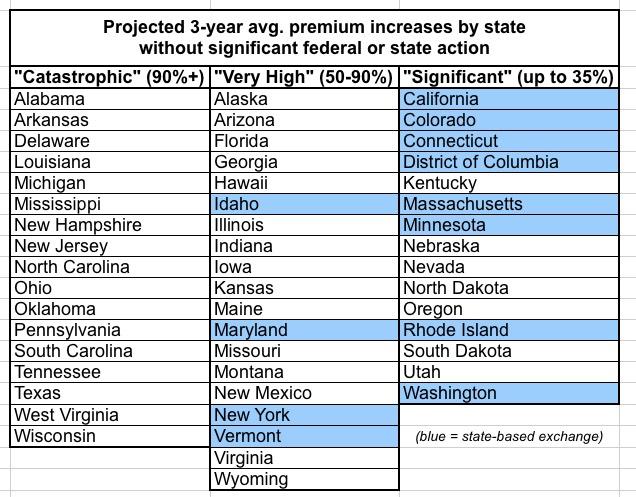
- Due to specific conditions unique to their region, 17 states are at greater risk of experiencing cumulative premium increases of 90 percent or more, and an additional 19 states could be at risk of experiencing hikes of 50 percent or more.
- Several policy actions at the federal and state level, including reinsurance, could reduce premium increases and help millions of middle-class Americans maintain their coverage and access.
SACRAMENTO, Calif. — A new analysis finds that every state in the nation is at risk for higher than normal premium increases due to continued policy changes and uncertainty at the federal level. In the absence of any federal action to address the current environment, the report estimates that premium increases across the nation could range from 12 to 32 percent in 2019 and have a cumulative premium-increase total between 35 and 94 percent by 2021 (see Table 1: National Projections of Individual Market Premium Changes: 2019-2021).
“The challenges to our health care system are threatening to have real consequences for millions of Americans,” said Peter V. Lee, executive director of Covered California, the sponsor of the study released today. “The prospect of 30 percent premium increases in 2019 and hikes of over 90 percent over the next three years threatens access to coverage for millions of Americans.”
Table 1. National Projections of Individual Market Premium Changes: 2019-2021
(Note: I've slightly restructured the table to include the mid-point of each range estimate, as well as to break out the portion of the increase which would be due to Trump/GOP sabotage efforts instead of normal medical inflation/etc):

Because percentage increases are cumulative, you can't simply add the three numbers together. If rates go up 25% in 2019, another 14% in 2020 and another 14% in 2021, that's actually a cumulative total increase of 62.4%, not 53%.
The analysis, “Major Indicators of Individual Market Stability Highlight High Premium Increases for States in Coming Years,” is a national economic analysis of potential premium increases, state-by-state impacts and estimates of positive effects of federal policies. The report was informed by actuaries at health insurance companies and academics at the University of California, Los Angeles; the University of California, San Diego; and Harvard University, as well as a review of recent published reports. In addition, Milliman provided actuarial modeling related to the potential impact of instituting a federal state-based invisible high-risk pool or reinsurance program. The analysis was sponsored by Covered California as part of its efforts to understand future trends and inform the national policy discussion.
Milliman’s complete report on the potential impact of reinsurance can be found here.
The analysis also identifies steps that can be taken to reduce the risks of these significant premium increases. Among the solutions is an analysis of the positive impact that a federal reinsurance program could have in 2019 if implemented soon.
“We project that a nationwide reinsurance program with annual funding of $15 billion could result in average premium reductions of 16 to 18 percent,” said Robert Cosway, consulting actuary at Milliman. “Lower premiums would affect both consumers and the amount that the federal government pays in the form of tax credits. The marginal cost of the reinsurance program would be much lower than $15 billion when you consider the reduction in the cost of the federal government’s tax credit payments.”
Previous Covered California analysis has shown that because reinsurance programs result in lower premiums and lower expenditures for premium subsidies, a program funded with $15 billion would have a net cost to the federal government of only $5 billion due to reduced Advanced Premium Tax Credit spending.
In other words, Let's say that an insurance carrier has 100,000 enrollees with an average cost of, say, $500/month each. That's a total cost of $500 million to the carrier. However, what if just 1,000 of those enrollees are eating up a full 30% of the claims ($150 million), at an average cost of $150,000 per year apiece? Under a reinsurance program, the government might reimburse the insurance carrier for, say, 90% of the cost of patients costing more than $50K, or about $90 million. This lops about 18% off the carrier's expenses. Since the ACA requires them to spend at least 80% of premiums on actual healthcare costs, that means they'd have to drop their premium rates by about 18% the following year (ok, probably more like 16% after other factors are added).
On the surface this makes it sound like the government has to shell out $90 million...but remember that if the unsubsidized premiums drop 16%, that also means the subsidies which the government has to pay out to around 85% of the enrollees would drop somewhat as well, cancelling out a big chunk of that $90 million. This is basically how it works in Alaska, Oregon and Minnesota already, though the details vary a bit in each state. CoveredCA is projecting that a good 2/3 of the cost would be cancelled out, resulting in a net cost of only around $30 million in the scenario I just described.
Other policies that could reduce premiums or promote stability include a return to providing direct federal funding for the required cost-sharing reduction subsidies, which help low-income consumers with lower copays and deductibles. Increased spending in federal marketplace states on marketing to promote enrollment among healthier individuals would yield a very positive return on investment, with the beneficiaries of that investment being federal taxpayers. New state policies could promote enrollment and protect consumers from new health insurance products that have huge gaps in coverage and may siphon off healthier people from individual market risk pools.
In other words, stop #ShortAssPlans from proliferating. Even as I type this, states like Washington are banning #ShortAssPlans at the same time that Idaho and Iowa are opening up the floodgates on them.
In addition to the projected premium increases, the analysis uses key indicators of marketplace stability to assess which states are more or less likely to be at risk of experiencing catastrophic rate changes.
According to the report, every state is at risk of cumulative premium increases of at least 35 percent over the next three years. Seventeen states could face premium increases exceeding 90 percent during that time, and an additional 19 states could face increases of 50 percent or more. These increases could be due to a variety of factors, including the recent decision to remove the federal penalty for being uninsured, the administration’s attempt to introduce new short-term plans that may damage the overall risk mix of consumer pools by siphoning off healthy consumers, and the continued underinvestment in federal marketing and outreach.
“We commissioned this work to shed light on the variation in the potential impact of policy changes such as the removal of the penalty, cuts in marketing in federal marketplace states and new products like association health plans and short-term, limited-duration health plans,” Lee said. “Health care is local, and the impacts of changes in federal policy will play out differently across the nation. The conclusion is that there are no ‘winners’ — rather, the range of impacts is from bad to very bad.”
Using key risk indicators to help gauge the overall health of a marketplace, the analysis examined the situation each state faces based on its risk score and enrollment trend.
- Centers for Medicare and Medicaid Services (CMS) risk score: Measures the overall health of the consumer pool in the state’s individual market — based on the individual’s demographic and health-status information — and how it compares to the national average. A negative number means the consumer pool is healthier than the national average.
- Enrollment trend: The number of consumers enrolled in a marketplace plan. While there are many ways to look at trend, for the purpose of simplicity this analysis examined the change between 2017 and 2018 enrollment.
When taken together, these “risk indicators” provide strong signals of whether a state will be more or less likely to have higher premium increases and market instability.
While subsidized consumers would be insulated from these increases, which would increase the amount of financial assistance they receive, unsubsidized consumers would bear the full weight of the higher premiums. A previous Covered California study estimated that 6 million Americans on the individual market, both on- and off-exchange, do not receive subsidies and have a median income of $75,000.
“Lower-income Americans will be largely shielded from these price hikes, but the real-world consequence for middle-class Americans who do not receive any financial assistance in the form of tax credits is that many will be priced out of having health insurance,” Lee said.
The analysis, which provides a snapshot and projection for potential premium hikes for each state, is available in an interactive map.
The report finds that all states are at risk of high cumulative premium increases over the next three years, but based on the two indicators, the relative risk of increase differs.

Advertisement
