

CMS Effectuation Report, Part 1: Playing games with start & end dates, and But What Of Silver Loading?
Tue, 07/03/2018 - 8:56am
NOTE: My broadband connection has been experiencing a lot of problems lately; I have a service guy on his way out today for the fourth time in the past two weeks, but this means I'll likely be offline for a few hours, so this post will be incomplete for awhile.
Yesterday, the Centers for Medicare & Medicaid released three important new reports. I did an initial write-up about their overall findings yesterday; today I'm taking a deeper look at the actual reports themselves.
First up, the February 2018 Effectuation snapshot report:
As of March 15, 2018, 10.6 million individuals had effectuated coverage through the Federal and State-Based Exchanges for February 2018, meaning that they selected a plan, paid their first month’s premium, if applicable, and had coverage in February 2018. The total number of members with February 2018 coverage is about 9 percent lower than the number of individuals (11.8 million) who made plan selections during the 2018 Open Enrollment period, as reported in the 2018 Open Enrollment Final Report released by CMS in early April. The number of individuals with effectuated coverage for February 2018 is approximately 3 percent higher than February 2017 effectuated enrollment of 10.3 million individuals, as of March 15, 2017.
Bingo...this is exactly what I was referring to yesterday. Last June, I busted CMS for changing their "early year effectuation report" as-of date from the end of the first quarter (the number effectuated for the month of March), which they had used in 2015 and 2016, to a month earlier (the number effectuated for the month of February, as measured in mid-March).
Why is this such a big deal? Because of how the end dates changed from 2017 to 2018 and because of the lag time between the enrollment date and the effectuation date.
While a couple of states have slightly later deadlines, generally speaking, here's how the enrollment/effectuation date calendar worked for the 2017 enrollment period:
- Enrolled between 11/01/16 - 12/15/16, effectuated on 1/01/17
- Enrolled between 12/16/16 - 1/15/17, effectuated on 2/01/17
- Enrolled between 1/16/17 - 1/31/17, effectuated on 3/01/17
How much of a difference does that make? Well, according to my spreadsheet, as of 1/15/17, around 11,719,286 people had signed up for an exchange policy.
That means that if I'm reading the CMS press release correctly (and I admit the wording of it is a bit confusing...deliberately, I suspect), that means that instead of dividing 10,330,759 numerator into the full 12,216,003 denominator, it should only be divided into 11,719,286.
Assuming I'm reading the CMS report correctly, that means that as of 3/15/17, 88.2% of January and February enrollees had paid their first monthly premium. That's a net drop of only 11.8%, a couple of points better than prior years.
Again, that's 11.8%, not 15%.
Now, let's compare that to this year:
- Enrolled between 11/01/17 - 12/15/17, effectuated on 1/01/18
- Enrolled between 12/16/17 - 1/23/18 (9 states only, with varying end dates), effectuated on 2/01/18
- Enrolled between 1/24/18 - 1/31/18 (DC/NY/CA all ended on 1/31), effectuated on 3/01/18
According to my 2018 Open Enrollment spreadsheet, as far as I can tell, as of the 1/15/18 deadline for 48 states, practically all of the 11.75M total enrollees nationally had already signed up.
In other words, when you correct for the change in "as of" effectuation dates and the end dates, you're really dividing into nearly the same denominators for each year...which means that yes, February effectuations were a bit higher this year than last (90.6% vs. 88.2%...about 2.4 percentage points higher), but not by nearly as much as CMS is claiming in their new report (91% vs. 85%...6 percentage points higher).
I'm not saying this improvement has no significance, just that it's far less significant than CMS is claiming.
Based on historical enrollment trends for the Exchanges, CMS anticipates that a significant number of people who effectuated coverage in early 2018 will not stay in their plans for the full year. For example, while 10.3 million individuals had effectuated coverage for February 2017 (as of March 15, 2017), by the end of the year, only 8.9 million individuals remained in their plans, according to data released today. This is likely caused by consumers struggling to pay premiums as costs continue to increase. In addition, the numbers reported today may be revised in future months as additional data on new effectuations, terminations, and cancellations become available. CMS intends to publish later this year effectuated enrollment data for the first six months of 2018, which will include an updated snapshot of February 2018 enrollment.
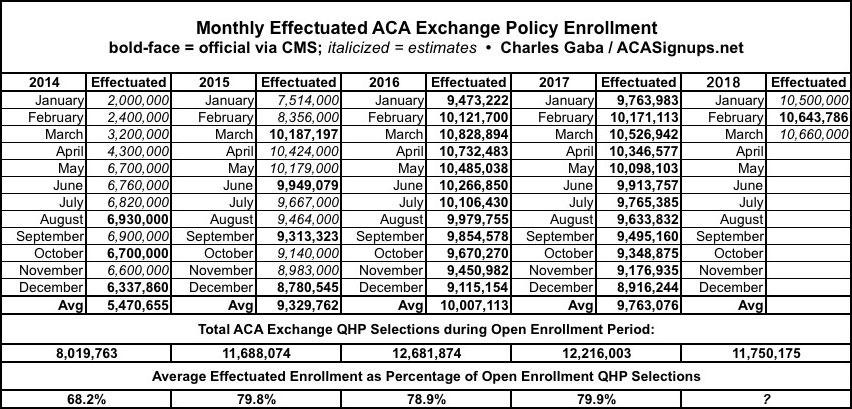
This is handy info, but it's actually far less significant than it may seem when you compare it to prior years. I did exactly that a year ago, and now I can update both the spreadsheet and graph to include all of 2017 and the first few months of 2018:
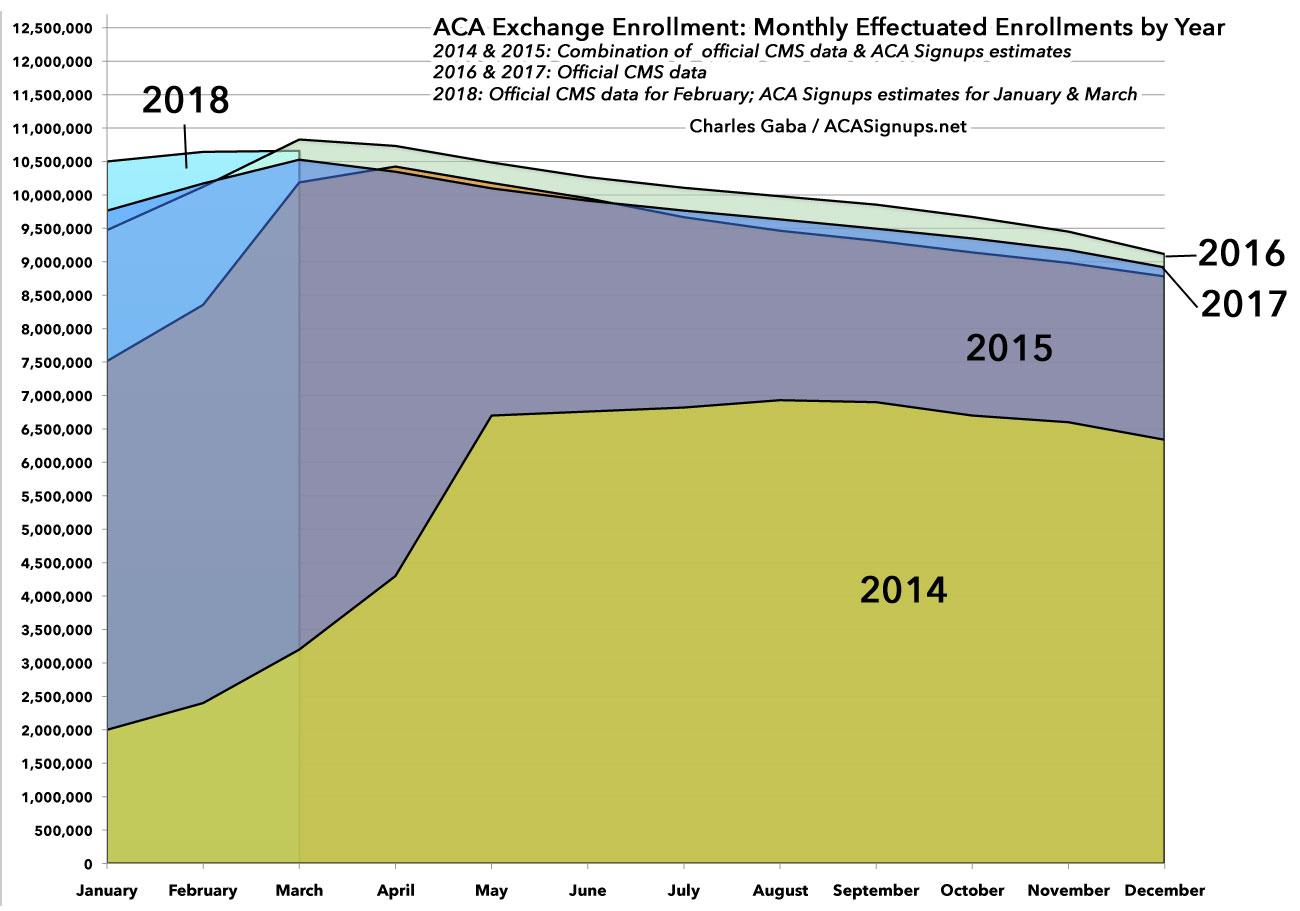
Yes, February 2018 effectuated enrollment was the highest it's ever been...but that's because open enrollment ended in mid-December in 42 states. That means that a higher percentage of those who signed up had their policies go into effect in either January or February. There's nothing wrong with that, of course...but it also means that the attrition rate will likely be pretty much in line with 2015, 2016 and 2017 for the rest of the year, likely ending with somewhere between 8.8 - 9.0 million exchange enrollees in December.
As you can see in the data table below, if you divide the average monthly effectuations into the total QHP selections for each year, it was remarkably stable in 2015, 2016 and 2017...around 79-80% each year. The earlier start date for most 2018 enrollees should bump up the monthly average effectuations to perhaps 9.9 million instead of last year's 9.8 milion (which would also bump the % of QHP selections up to around 84%), but I wouldn't expect too much of a change otherwise.
As a side note, 2014 was obviously a complete outlier for several reasons, but mainly because of a) the early technical problems at launch in late 2013 and b) the fact that the first Open Enrollment Period lasted a full six and a half months, not officially wrapping up until April 15th...which meant that something like 40% of 2014 enrollees didn't actually start their coverage until April or May. This also played havoc with the monthly average exchange enrollment for the year.
This report also shows that the proportion of the population that enrolled on Federal and State-Based Exchanges and received advance premium tax credits (APTC) increased slightly for February 2018, to 87 percent, from an average of 84 percent for the 2017 plan year. The average total monthly premium per enrollee increased by 27 percent for February 2018 over the average total monthly premium per enrollee for the 2017 plan year; however, the average monthly amount of APTC per enrollee receiving APTC rose more sharply, by 39 percent, compared to the 2017 average monthly APTC per enrollee receiving APTC.
The increase from 84% of enrollees being eligible for ACA subsidies to 87% makes perfect sense for several reasons.
- First of all, the Federal Poverty Line threshold increased by 1-2% from 2017 to 2018. If you multiply that by 4 (400% FPL), that means a single adult earning $720 more (or a family of four earning $1,200 more) fell within the 400% FPL potential eligibility threshold.
- Secondly, as Louise Norris has explained in the past, the ACA's "percent of income" subsidy formula changes slightly from year to year. In 2017, a benchmark Silver plan had to cost more than 9.69% of your income in order for you to be eligible for tax credits...but in 2018 this dropped slightly to 9.56%. That's only about a $5/month difference for a single person earning $48K/year, but it still means more people were eligible for subsidies this year than last. (Unfortunately, this increasing again in 2019 up to 9.86% for whatever reason, or around $12/month for that $48K adult).
- Third, and most importantly: When the unsubsidized benchmark premium increases, that means a whole lot of people who weren't eligible for ACA subsidies last year suddenly find themselves eligible this year. Let's say someone earns between 300-400% FPL in 2017 (call it 350% for a single adult...around $42.2K). In 2017, it's possible that the benchmark plan cost 9.5% of their income...call it $4,000 even. They wouldn't qualify.
However, in 2018, let's suppose the benchmark plan premium increased by a whopping 28%, to around $5,120/year. That's 12.1% of this person's income, putting them squarely within the subsidy-eligible zone. They'd qualify for around $1,080 in subsidies, or $90/month.
OK, what else?
Cost-sharing reduction (CSR) enrollment is the total number of individuals who had an active policy in February 2018, who paid their premium, if applicable, (thus effectuating their coverage), and received cost-sharing reductions (CSR).3 While CMS discontinued advance CSR payments to issuers in October 2017, issuers continue to provide reduced cost-sharing to eligible consumers in 2018 in compliance with Patient Protection and Affordable Care Act (PPACA) requirements. A consumer is generally eligible for CSR if the individual is eligible for APTC, has a household income between 100 percent and 250 percent of the federal poverty level, and enrolled in a health plan from the silver plan category. American Indians and Alaskan Natives are eligible for CSRs under different criteria.
It's worth noting, as Margot Sanger-Katz did, that CMS doesn't mention a peep about Silver Loading. Nada. Zilch. Which I find amusing, since Silver Loading was developed as a clever pricing strategy by the exchanges, state regulators and carriers as a workaround to deal with the attempted sabotage of Cost Sharing Reductions by the Trump Administration.
Advertisement
