

CMS Effectuation Report, Part 3: Avg. 2018 premium hikes and 2017 effectuations by month
Thu, 07/05/2018 - 4:23pm
A few days ago, the Centers for Medicare & Medicaid released three important new reports on the 2018 Open Enrollment Period and trends in the individual market. There's a lot of data to go over, so I'm breaking my analysis into several smaller posts for easier readability.
Overview • Part One • Part Two • Part Three • Part Four
- February 2018 Effectuation snapshot report
- Subsidized/Unsubsidized Enrollment Trend Report
- Exchange Trends Report
Next, let's take a look at the average unsubsidized monthly premiums and APTC subsidies in each year. I've already crunched all of these data before, but that was based on the QHP selctions from the 2017 and 2018 Open Enrollment Periods. The table below is more accurate since it reflects the actual average premiums and subsidy amounts for all of 2017 and for 2018 after subtracting out nearly all of those who never actually paid for their first month of coverage. The numbers for each state and nationally should be close but slightly different:
(I've highlighted the 2 states (Alaska and Minnesota) which saw average premium drops thanks to their state-based reinsurance programs, as well as the five states which saw rate increases of over 50% this year.)
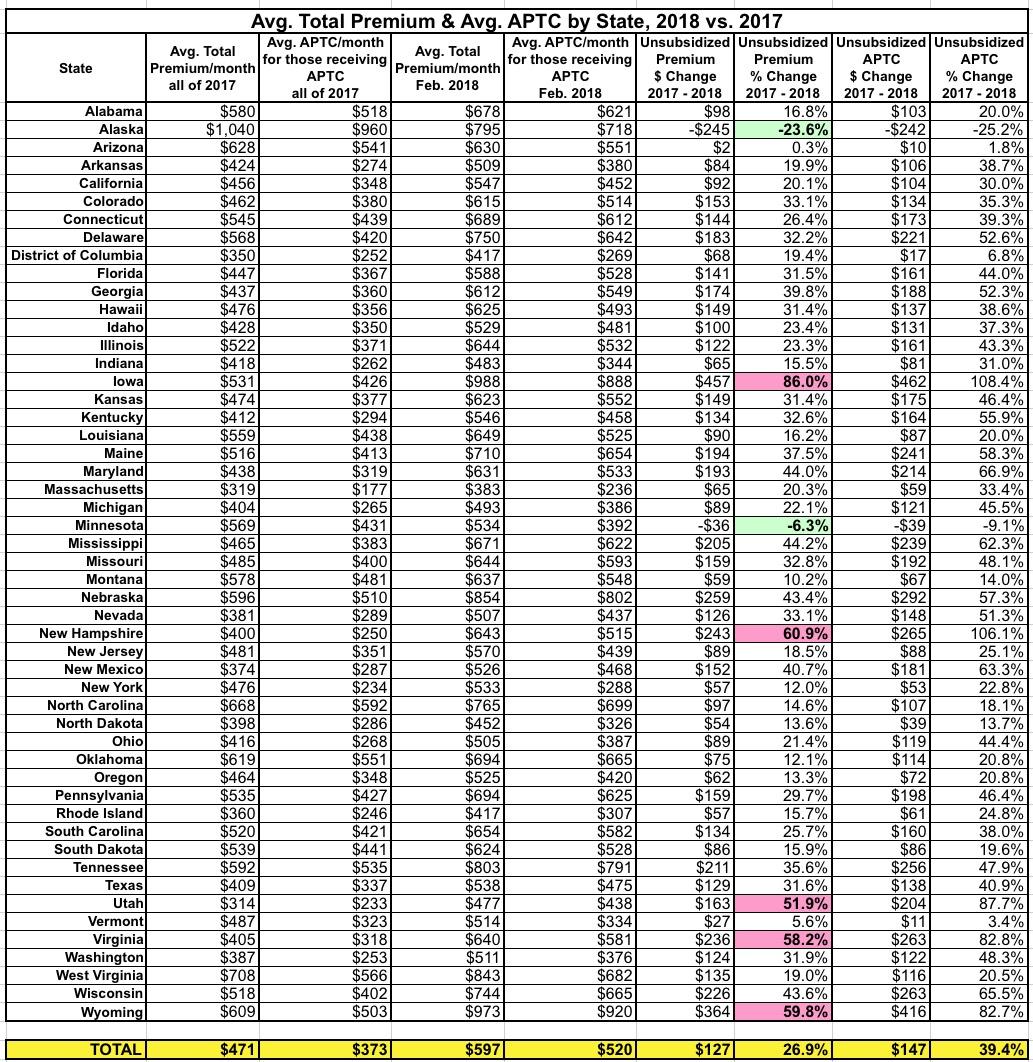
Last fall, I projected that average unsubsidized premium rates would increase by an average of 29.7% nationally...but cautioned that this assumed that every single 2017 ACA individual market enrollee renewed their enrollment in the same policy (or was mapped over to a similar one). When I ran the OE5 vs. OE4 numbers, it came out slightly lower (increasing by 27.9%, from $469/month to $600/month).
With the actual data now in for all of 2017, it looks like the effective average increase was slightly lower yet: 26.9% (from $471/mo in 2017 to $597/mo in 2018). To the best of my estimates, about 63% of that (17 percentage points) was due to deliberate sabotage efforts by the Trump Administration (mostly cutting off CSR reimbursement payments, but also other smaller factors like slashing the enrollment period in half, slashing the marketing budget by 90%, slashing the outreach/navigator budget by 40% and so forth):

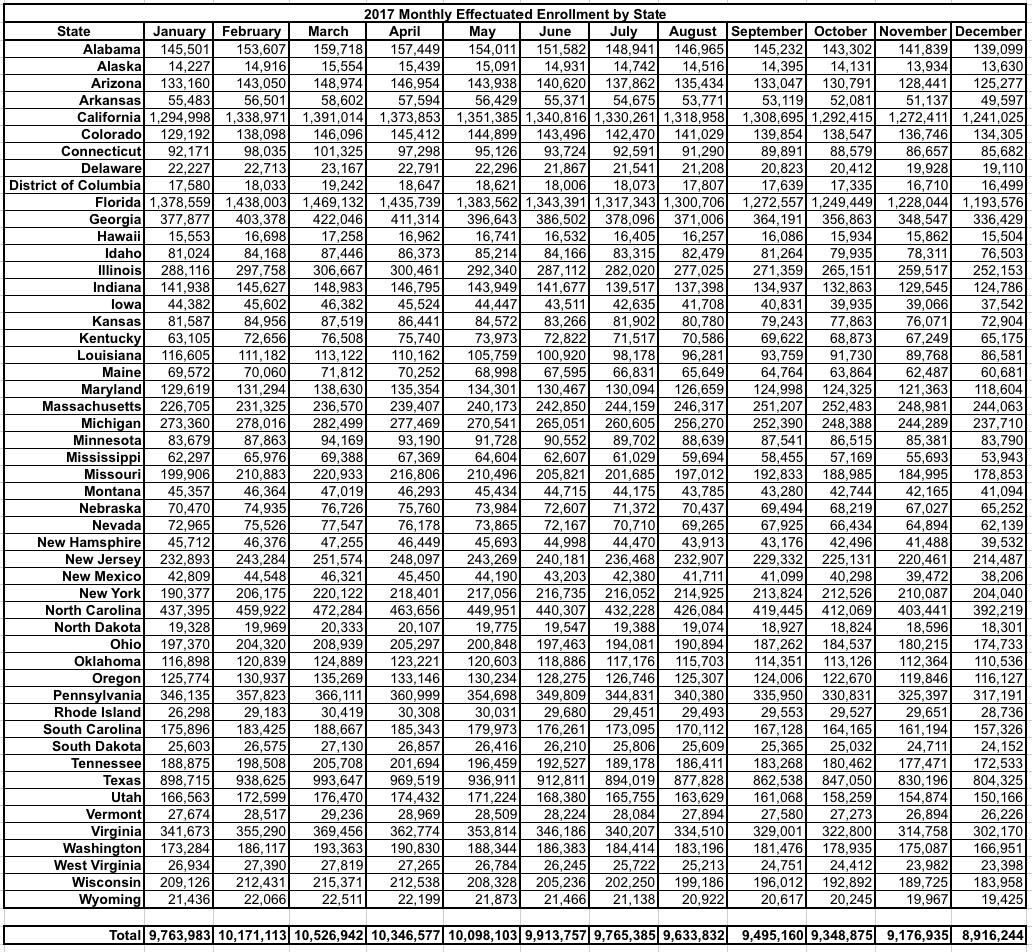
The 2018 Effectuation report also includes a chart showing the 2017 Monthly Effectuated Enrollment by state. I already noted in Part One that nationally, the retention/attrition pattern throughout the year was pretty much identical in 2017 to what it was in 2015 and 2016: Peaking at around ~10.5 million enrollees in March or April before gradually slipping down to around the ~9 million mark by December. I tried a graph showing the trend for each state but it got to be too unwieldy and doesn't really reveal anything terribly noteworthy anyay.
Advertisement
