

Final 2026 Open Enrollment Report: Premiums & Financial Assistance (Part 3)
Fri, 03/27/2026 - 4:01pm
Next up: Premiums, Advance Premium Tax Credits (APTC) and Cost Sharing Reduction (CSR) assistance.
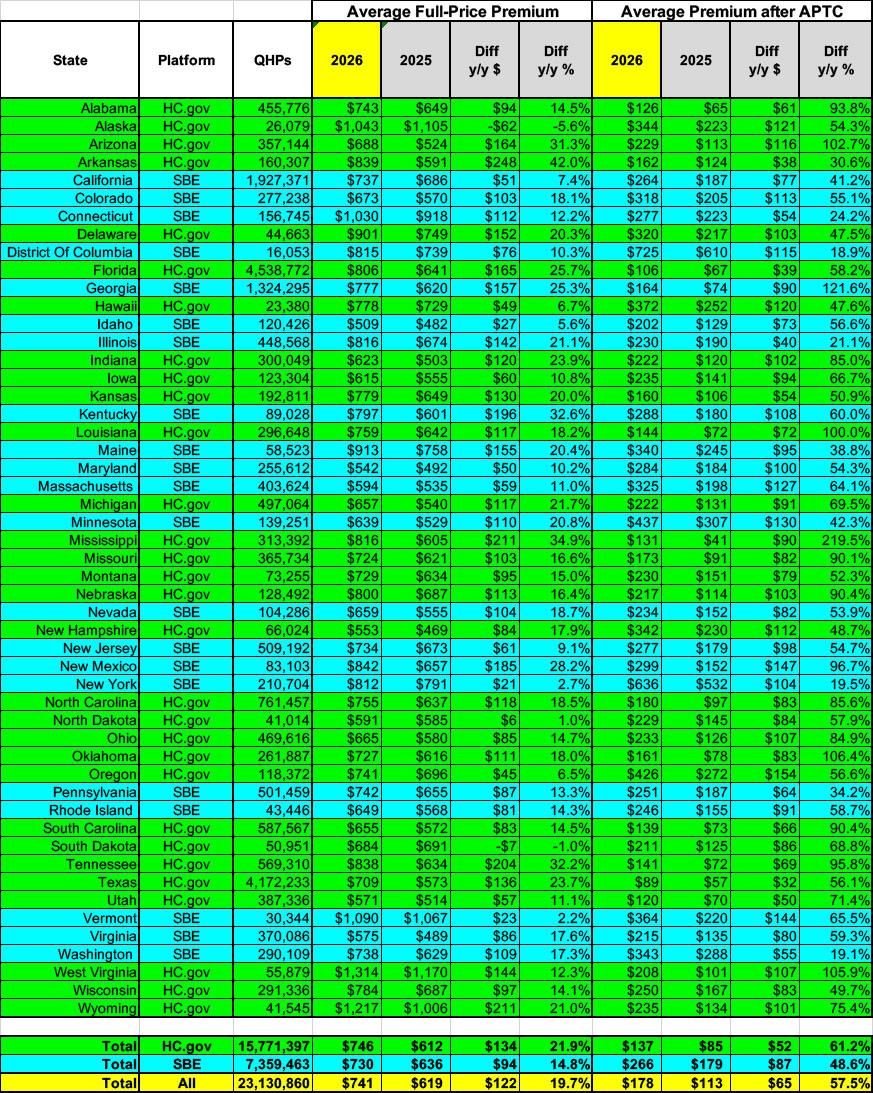
Nationally, the average unsubsidized premiums for 2026 exchange-based Open Enrollment Period enrollees are $741/month, up $122/month or 19.7% from last year.
This is a smaller average gross increase than the 25.5% I had projected last fall...for two rather obvious reasons, which I try to make clear every year:
- First, the projected average assumes that 100% of existing enrollees re-enroll, which of course never happens; there's always some amount of churn of existing enrollees dropping coverage (an especially big problem this year) and new enrollees signing up. Only 19.5 million of those who were enrolled in ACA exchange plans as of December 2025 actually re-enrolled for 2026 (making up 84% of 2026 enrollees).
- Second, the projected average assumes that every one of those renewing enrollees remains in the exact same policy, which, again, never happens as there's always a lot of people who switch metal levels, switch plan type, switch carriers and so on each year...and again, that's especially true for 2026 (I've written about this before and will talk about it again in more detail soon).
In any event, Arkansas saw the highest real world full-price average rate increase: A whopping 42%. Some of this is due to their implementing robust Premium Alignment pricing, but that doesn't account for the dramatic rate hikes in most other states.
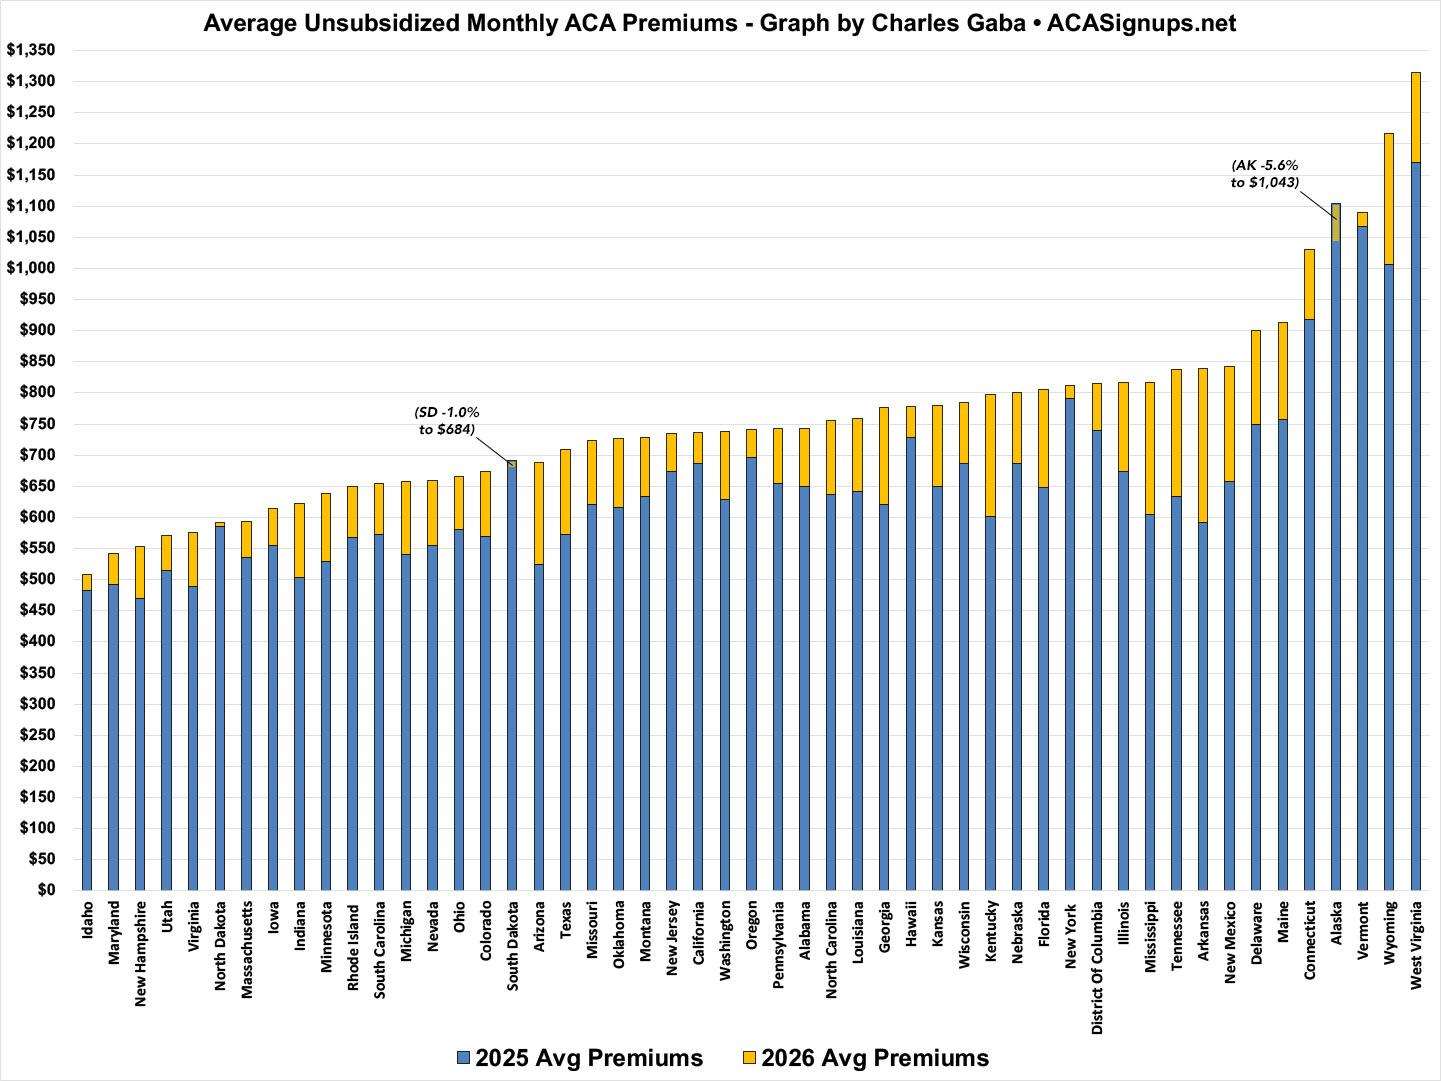
- Two states actually saw average decreases: Alaska dropped 5.6% (vs the projected 1.1%), while South Dakota dropped 1.0% (vs. a projected 6.4% increase).
- Every other state saw rate hikes, with most of them being well over double digits as I had projected:
-
Average rates in 8 states went up a relatively "reasonable" 1 - 9% y/y
(ND, VT, NY, ID, OR, HI, CA & NJ) -
Average rates in 25 states went up between 10 - 20%
(MD, DC, IA, MA, UT, CT, WV, PA, WI, RI, AL, SC, OH, MT, NE, MO, WA, VA, NH, OK, CO, LA, NC, NV & KS) -
Average rates in 11 states went up between 20 - 30%
(DE, ME, MN, WY, IL, MI, TX, IN, GA, FL & NM) -
Finally, rates in 5 states shot up by over 30%: AZ, TN, KY, MS & AR...again, with Arkansas breaking 42% overall.
-
Here's what the actual average monthly premiums look like like visually for 2026 vs. 2025, sorted lowest to highest by avg. 2026 rates:
Next, average premiums after federal subsidies are applied are $178month, up $65/month per enrollee...a whopping 57.5% year over year.
Again, this is considerably lower than the 114% average increase, which, again, I warned would likely be the case earlier this year:
When KFF ran that analysis last fall, the only way they could do it was to make several assumptions, including the following:
- That 100% of current enrollees (roughly 22.6 million as of September) would re-enroll into a 2026 exchange plan, and...
- ...that all 22.6 million of them would be re-enrolled into the same exchange plan they had in 2025.
BOTH of these assumptions are bound to prove false for completely understandable reasons (and I'm in no way criticizing KFF for making them, because there was no other way to run a projection like this at the time).
The reasons should be obvious if you think about it for even a moment:
1. Millions of existing enrollees downgraded their plans to try & avoid at least some of the net premium hikes
...2. Many others (potentially several million) were just priced out of the market altogether.
...3. SUPPLEMENTAL STATE SUBSIDIES & PREMIUM ALIGNMENT.
Nationally, the lowest average premium increase after subsidies are applied is the District of Columbia, where they "only" went up 18.9% ($115/month)...which makes sense since DC also has the lowest percent of ACA exchange enrollees who are receiving federal subsidies to begin with (just 18.8%).
The highest post-subsidy average rate increase is Mississippi, where they shot up from just $41/month to a whopping $131/month literally overnight on New Year's Eve, a stunning 220% hike...which, again, also makes sense since Mississippi has the highest percent of its ACA enrollees relying on federal tax credits (over 95%)!
It's worth noting that 9 of the 10 states with the lowest average net premium increases are blue states: DC, WA, NY, IL, CT, PA, ME, CA & MN, with Arkansas being the sole exception (presumably due to their newly-implementing robust Premium Alignment this year, as did both WA & IL). None of these went up by more than 42% (which is still pretty bad, of course).
At the same time, 8 of the 10 states with the highest average net increases (all of which shot up by 90% or higher) are red states: MS, GA, OK, WV, LA, TN AL & SC. The exceptions are swing state Arizona and blue state New Mexico...although it's critical to keep in mind that these increases only include federal tax credits, not the supplemental state-based subsidies which many blue states are offering this year. Again, New Mexico is backfilling 100% of all lost federal subsidies for 100% of their enrollees.
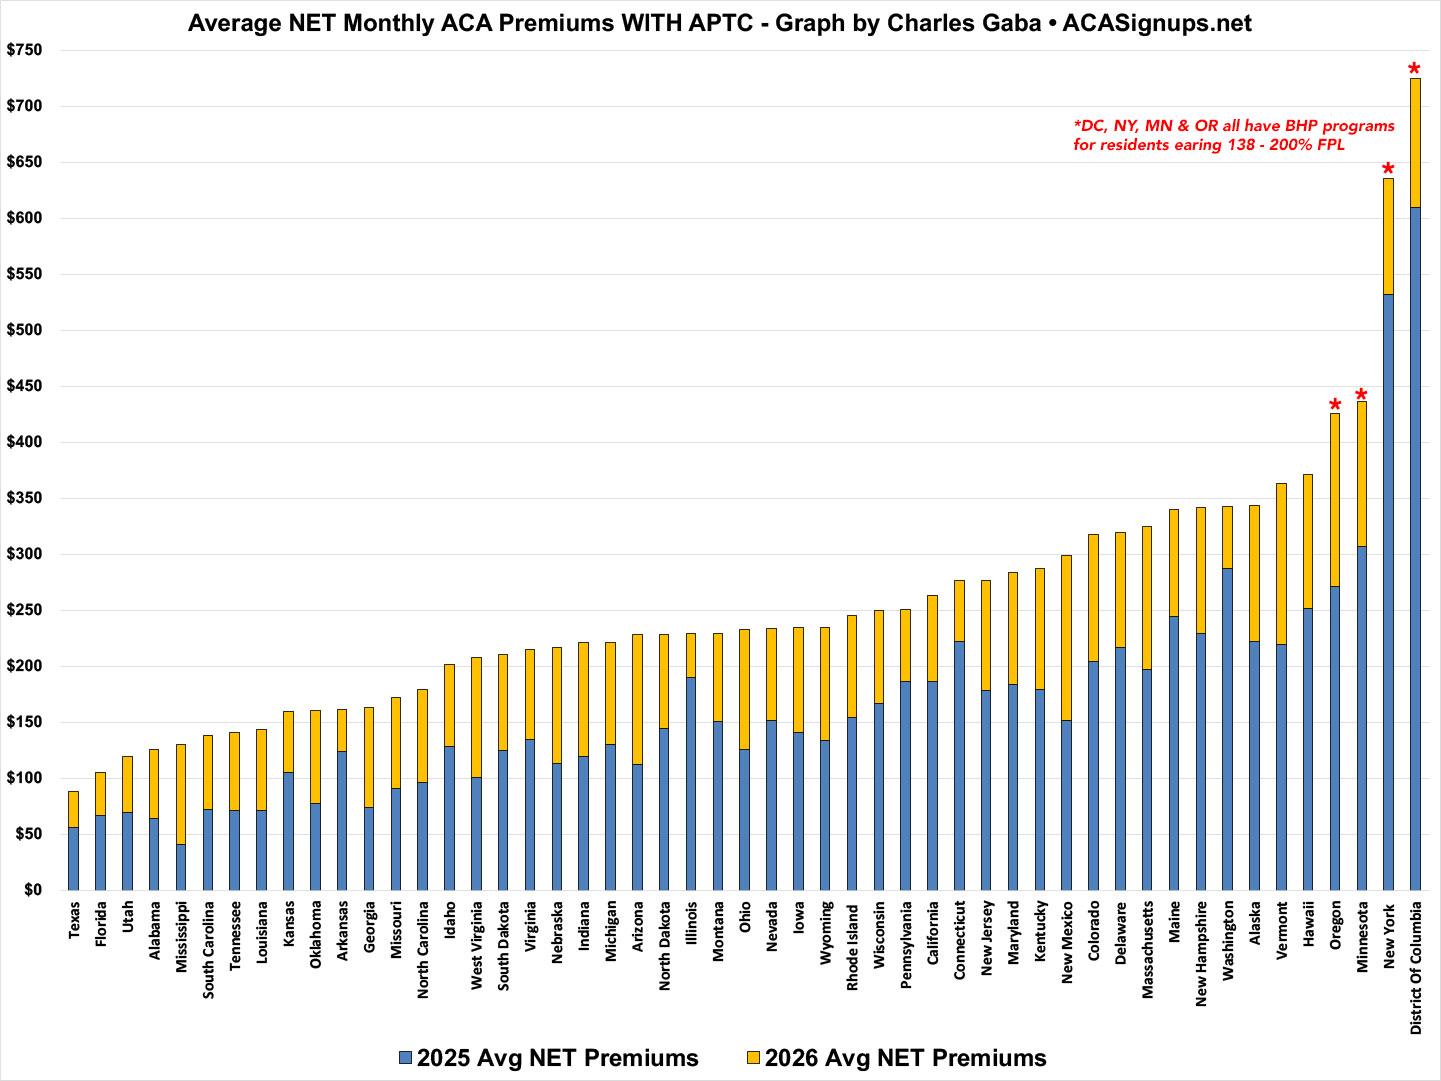
In terms of actual net premiums (again, after federal subsidies are applied), however, Texas has the lowest on average thanks to their robust Premium Alignment pricing strategy, while DC has the highest.
The main reason DC (along with New York, and to a lesser degree Minnesota and Oregon) has such high average premiums for QHP enrollees even after federal subsidies are applied is that all four of them have Basic Health Plan (BHP) programs in place for residents who earn between 138 - 200% of the Federal Poverty Level (FPL). Since this is also an income bracket which sees a greater benefit of the subsidies on a percent of income basis, it means that those who are enrolled in ACA plans have disproportionately higher net premiums:
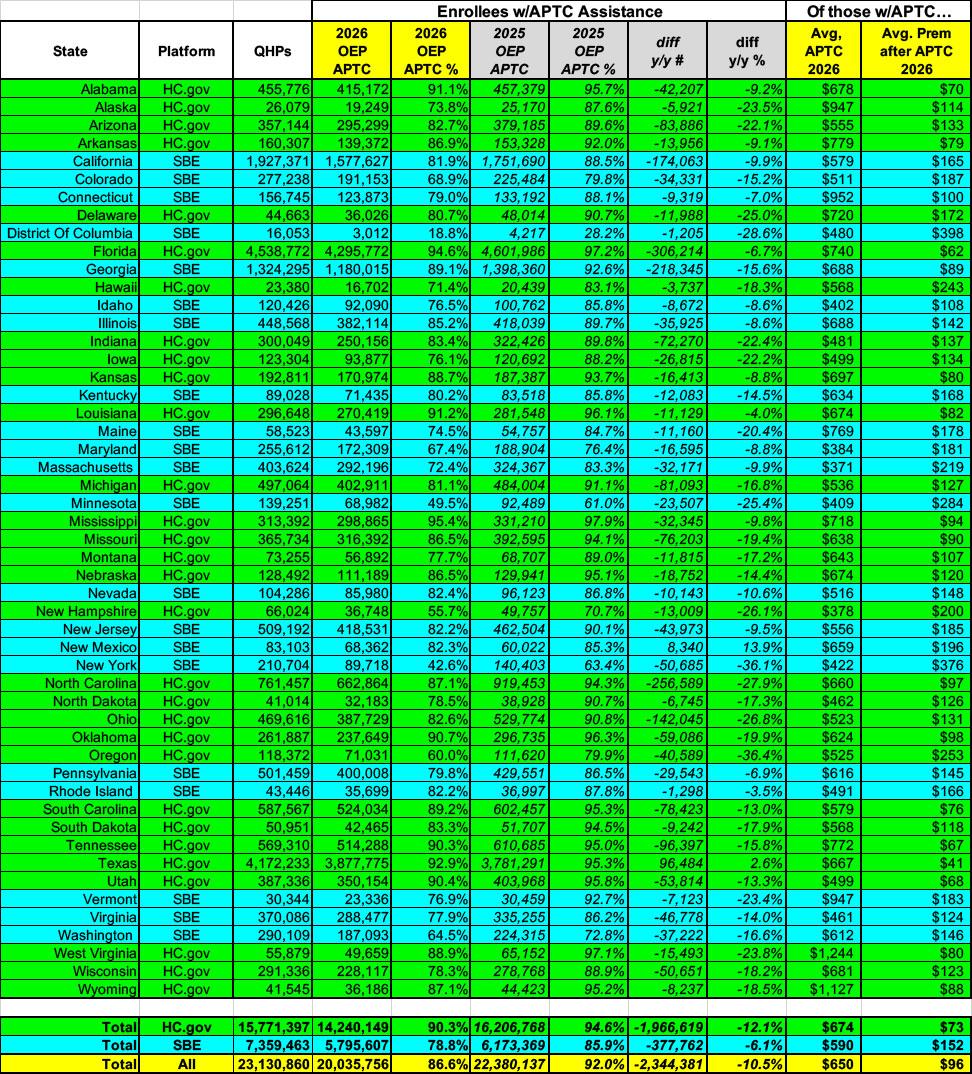
Next, here's the state-level breakout of how many enrollees are actually receiving Advanced Premium Tax Credit (APTC) assistance this year (after the enhanced APTC subsidies expired) versus last year.
Nationally, the percent of enrollees w/APTC has dropped from 92% to 86.6%...that's over 2.3 million fewer people receiving financial help than last year (more than a 10% drop) although again, 1.2 million of them were forced to drop out of the ACA market altogether. That leaves at least ~1.1 million additional enrollees who are stuck paying full price this year.
Florida is the state with the highest number of people who lost assistance (over 300,000), followed by North Carolina, Georgia and California. While this may seem obvious given that these are some of the largest states in the country, there's an important omission: TEXAS, the 2nd largest state, actually increased the number of enrollees who receive APTC help by over 96,000 enrollees! New Mexico is the only other state to add subsidies enrollment (around 8,300).
Next, here's the breakout of Cost Sharing Reduction (CSR) assistance by state compared against last year. Tragically, there's been a dramatic drop in both the number and percentage of enrollees receiving CSR help, from over 50% (12.3 million in 2025 to just 37% (8.6 million) this year.
That's over 3.7 million fewer Americans receiving help with their deductibles, co-pays & coinsurance, although again a large chunk of that had to drop coverage entirely (potentially up to ~1.2 million, although not all of those who dropped out were receiving CSR help to begin with).
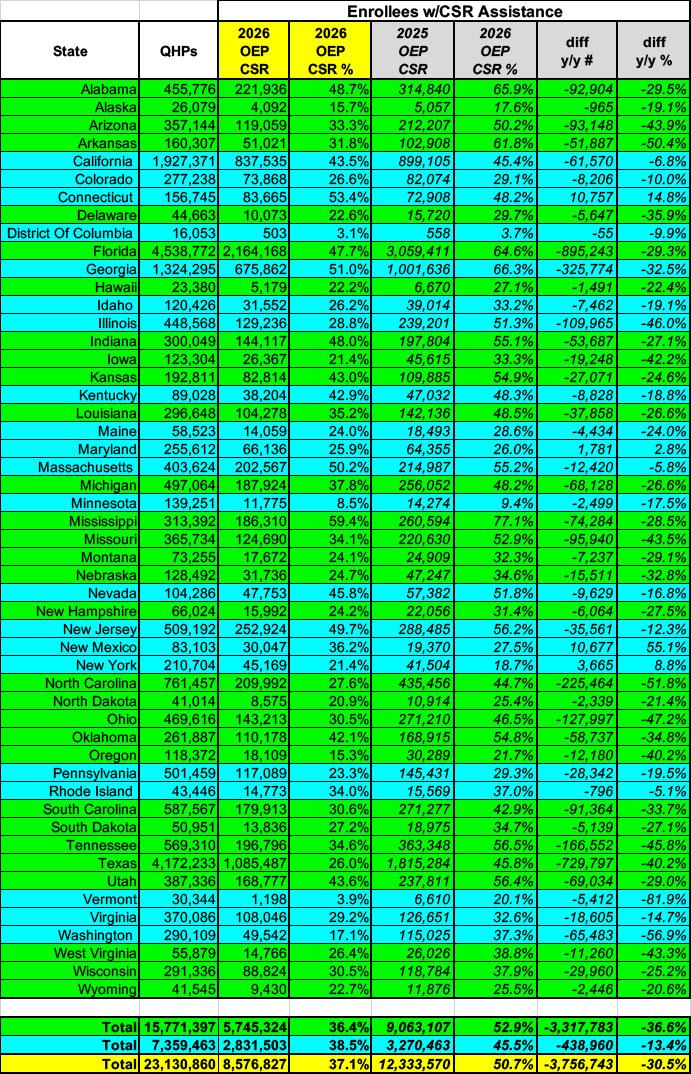
Once again it's Mississippi which has the highest enrollee dependence on CSR help...they dropped from 77% receiving it to 59% this year, still the highest in the country. In raw numbers, Florida again leads the way with nearly 900,000 Floridians losing eligibility for cost sharing subsidies.
On the flip side, Maryland, New York, New Mexico and Connecticut saw small to significant increases in those CSR eligible, interestingly, although the raw numbers are still nominal (27,000 across all four).
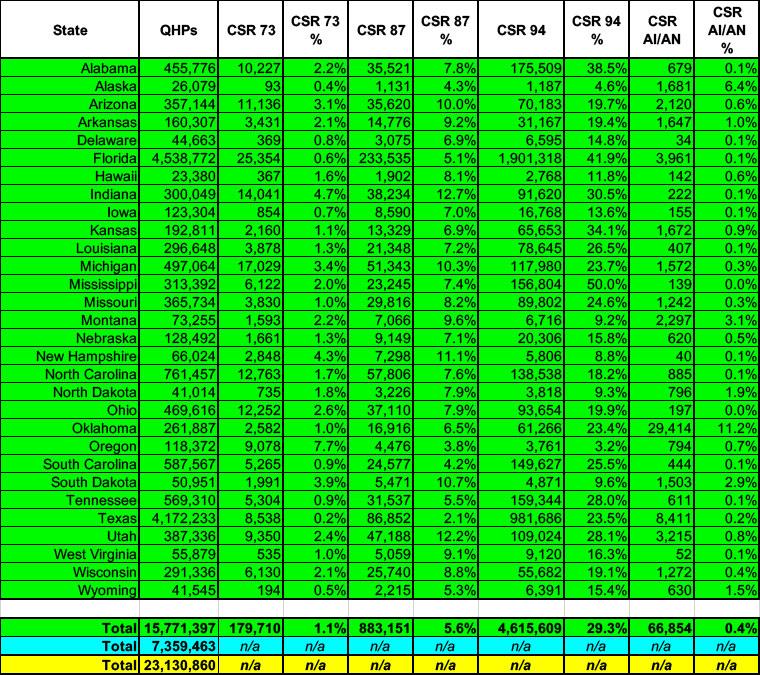
FInally, here's how the different types of CSR assistance enrollment break out by state (that is, by Actuarial Value, or AV). As a reminder:
- Officially, Bronze plans cover around 60% of aggregate enrollee medical expenses; Silver plans cover 70%; Gold covers 80% & Platinum covers 90%.
- However, Silver CSR plans (which are generally only available to enrollees who earn less than 250% of the federal poverty level) include additonal financial subsidies which boost their Actuarial Value over 70% by covering a chunk of out of pocket expenses (deductibles, co-pays & coinsurance).
- Thus, CSR 73, 87 and 94 plans have AVs of 73%, 87% and 94% respectively. The latter two are effectively in the same ballpark as Platinum (90% AV) plans, which is why I call them "Secret Platinum."
- The vast majority of CSR enrollees are at the highest level (94 AV)...over 29% of all exchange enrollees. 5.6% have 87 AV plans and just 1.1% have 73 AV coverage.
- There's also a small number of American Indians & Alaska Natives (just 67,000 nationally this year...0.4% of all enrollees) who are eligible for what amounts to a 100% AV (no cost sharing at all) Silver CSR plan.
Unfortunately, this breakout of CSR data is only available for the 30 states hosted by the federal exchange, but it's still useful info; I'll be revisiting this data in a later blog post.
Advertisement