

Which costs more: Employer-Based Insurance or ACA coverage? The answer may surprise you...
Thu, 04/16/2026 - 5:28pm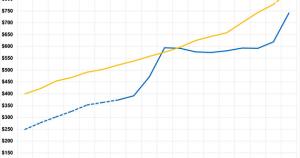
Note: This is an updated & expanded version of a post I wrote last October.
A couple of weeks ago, I received an email from a journalist who included this eyebrow-raising comment:
When I interviewed our Congressman, he said the ACA was a massive giveaway to insurers -- that premiums have increased 26% per year on average. That doesn't seem to match what little data I can scrape up, so I wanted to ask you: Since implementation in 2010, how much have premiums risen annually overall? Do you have data on how much or little they've risen or fallen for each year?
To this reporter's credit, he was skeptical about such a claim and reached out to me.
First of all: No, average ACA premiums have not, in fact, "increased 26% per year on average." A 26% annual increase, compounded each year, would add up to over a 4,000% increase if you start in 2010 (the year the ACA was signed into law by President Obama). Even if you assume this Congressman was using 2014 as his starting point (that was the first year ACA individual market plans were fully regulated), it would still amount to a whopping 1,500% cumulative increase since then.
Anyway, the reporter's question led me back to a post I published last fall, which I've decided to update & expand with more comprehensive data.
Last October, KFF (formerly the Kaiser Family Foundation) published their annual Employer Health Benefits Survey analysis, finding that...
Annual Family Premiums for Employer Coverage Rise 6% in 2025, Nearing $27,000, with Workers Paying $6,850 Toward Premiums Out of Their Paychecks
- More of the Largest Firms Cover GLP-1s for Weight Loss, and Use Is Higher Than Expected; Some May Be Limiting Coverage
Family premiums for employer-sponsored health insurance reached an average of $26,993 this year, KFF’s annual benchmark health benefits survey of large and smaller employers finds. On average, workers contribute $6,850 annually to the cost of family coverage, with employers paying the rest.
Family premiums are up 6%, or $1,408, from last year, similar to the 7% increase recorded in each of the previous two years. This year’s increase compares to general inflation of 2.7% and wage growth of 4% over the same period.
Over the past five years, the cumulative increase in family premiums (26%) and in what workers pay toward family premiums (23%) is similar to inflation (23.5%) and wage growth (28.6%).
Many employers may be bracing for higher costs next year, with insurers requesting double-digit increases in the small-group and individual markets on average, possibly foreshadowing big increases in the large-group markets as well. Employers continue to single out drug prices as a factor contributing to higher premiums in recent years.
There's a lot more in both the press release as well as in the actual survey results, but I want to take a moment to compare the Employer-Sponsored Insurance market (ESI), which provides healthcare coverage for 154 million Americans, with the ACA Individual market (ACA), which currently provides healthcare coverage for perhaps ~21 million people (not including the ~1.8 million enrolled in Basic Health Plan coverage in MN/NY/OR).
I know the KFF headline and lede are all about family coverage, but for my purposes I'm going to limit myself to single worker/single enrollee coverage because comparing family coverage can get messy.
- For Worker Only Employer-Sponsored Insurance (ESI) coverage, I'm using KFF data from their annual EHB Survey. This goes back to 1999, but I'm not starting it until 2009 because that's the year just before the ACA was signed into law (and the ACA's changes to individual market policies didn't really kick in until 2014). This covers the years 2009 - 2025.
- For 2026, I'm using this projected estimate from Mercer Consulting, a division of global professional services firm Marsh McLennan.
For average Individual or "Non-Group" market premiums (remember, the market existed before the ACA made major changes to it), I'm using (by necessity) several sources:
- For 2016 - 2024: The Centers for Medicare & Medicaid Services' (CMS) Full Year Effectuated Enrollment Tables (XLSX), which mostly focuses on effectuated enrollment data (duh), but which also includes a critical column: Average Total Premium per Month.
- For 2025 & 2026: CMS's Marketplace Open Enrollment Period Public Use Files, which include the same column but only for the initial Open Enrollment Period data (full-year averages, which will vary from these slightly, won't be available until at least July for 2025 and not until next year for 2026 for obvious reasons).
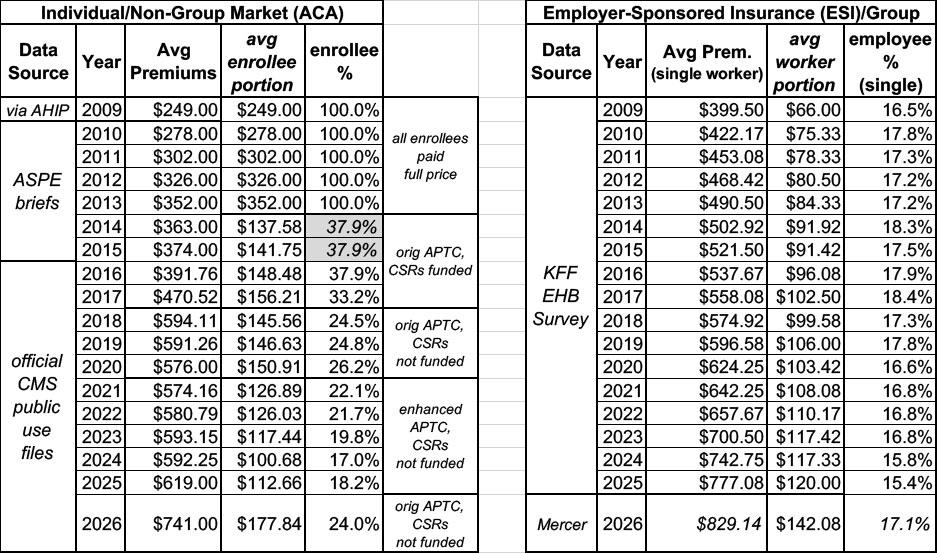
- For 2009, I found this AHIP Center for Policy & Research study which put the average premium that year at $2,985 for single coverage, or around $249/month.
- For 2010 & 2011, I found this brief from the Assistant Secretary for Planning & Evaluation (ASPE), which stated that:
In the individual market, the average premium increase (weighted by member months) was 9.9 percent in 2008, 10.8 percent in 2009, and 11.7 percent in 2010, and then declined to 8.6 percent in 2011.
This would put the average at $278/month in 2010 and $302/month in 2011.
- For 2012 & 2013, this ASPE brief states that:
...the average increase for policies in 2013 in the data available to date was slightly below the level in 2012 (7.9 percent for 2013 compared to 8.1 percent in 2012), providing no indication of an acceleration in the rate of growth of 2013 premiums, although these results are based on incomplete data.
While they note the data for those years was incomplete, those figures would put average individual market premiums at around $326/mo in 2012 and $352/month in 2013.
...average gross monthly premiums before advance premium tax credits for 2015 coverage would have been $374.
All of this just leaves 2014...which happens to also be the first year that ACA individual market regulations were fully implemented...but it seems pretty clear that average premiums in 2014 would fall somewhere in between 2013 & 2015.
Put these all together and you get the following:

Here's what this looks like visually:
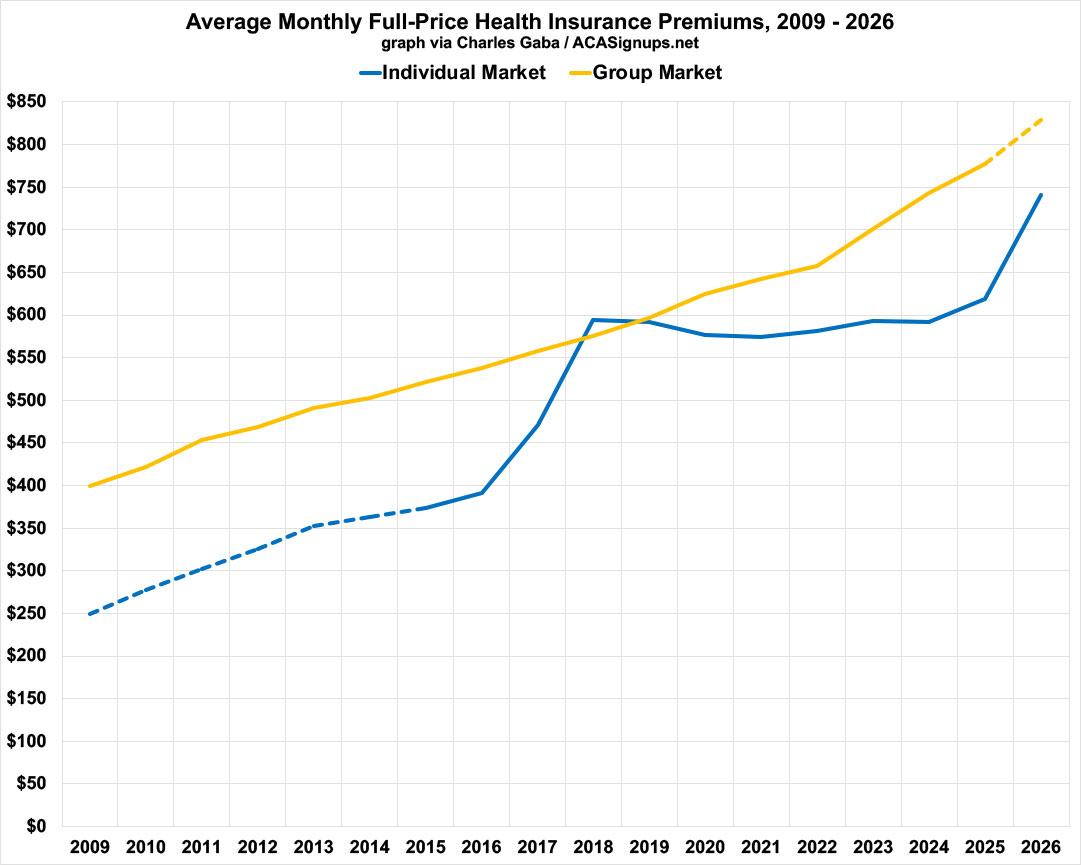
IMPORTANT: Yes, average individual market premiums cost around 38% less than average ESI premiums before the ACA was passed back in 2009, and yes, the ACA did indeed cause gross premiums to increase significantly starting a few years later...but there's an important reason for that: PRIOR TO 2014, INDIVIDUAL MARKET PLANS DIDN'T HAVE TO PROVIDE COVERAGE TO ENROLLEES WITH PRE-EXISTING CONDITIONS, and also didn't include a long list of other things which all ACA plans are required to include (community rating, a ceiling on out of pocket costs, NO annual or lifetime coverage limits, having to include free preventative care services, having to cover 10 Essential Health Benefits, etc etc.
Those requirements are literally the "Patient Protection" portions of the Patient Protection & Affordable Care Act.
As you can see, when looking strictly at premiums only, full-price (gross) ACA policies have actually cost considerably less than average ESI policies every year except 2018.
Of course, there's a vitally important caveat to this: Deductibles and other out-of-pocket expenses.
The Actuarial Value (AV) of a healthcare policy is, generally speaking, what percentage (in aggregate) of total healthcare claims that the plan provides coverage for.
Officially, ACA exchange plans have AVs of 60%, 70%, 80% or 90% (Bronze, Silver, Gold, Platinum), although more realistically they can run up to 94% AV in practice (a High-CSR Silver plan).
Using the 2025 & 2026 OEP Public Use Files, I've calculated the weighted average AV for current ACA exchange enrollees to be around 76.1% in 2026, down about 3.5 points from 79.6% last year. This is actually the core of a different post I plan on writing up soon, but let's stick a pin in that for the moment. The point is, since 2018, the average AV rating for HC.gov states has ranged from around 76% to 80%.

Meanwhile, according to this Dept. of Labor study from September 2024, ESI coverage averaged around 84.2% AV in 2021:
The following tables (Tables 6-14) show the average actuarial values by various plan characteristics for innetwork coverage. The overall average in-network actuarial value for 2021 was 0.842, meaning that on average, employer sponsored plans paid 84.2% of covered charges.
This may have changed since 2021, but is likely still fairly close.
In other words, average ESI premiums are higher than average ACA premiums, but ESI plans also cover perhaps 6 - 8% more of typical medical claims than ACA plans on average.
In fact, you can even make a rough estimate as to what the dollar cost differential is (I think I have the math right here):
IMPORTANT: REMEMBER, EVERYTHING ASSUMES FULL-PRICE, UNSUBSIDIZED PREMIUMS: No federal tax credits for ACA plans, no employer-paid portion of the ESI premiums.
- 2026 ACA plans premiums are ~$741/mo on average, or ~$8,892/yr. Via the ACA's Medical Loss Ratio (MLR) rule, around 20% of that should be the carrier's gross margin, leaving around ~$7,114, which, in theory, should cover around 76.1% of actual medical expenses (in aggregate). This would theoretically put average total medical expenses at around $9,347 per enrollee this year...which means, on average, ACA enrollees should have to spend around $2,233 in out of pocket costs.
- 2026 ESI plan premiums average around ~$829/mo, or $9,948/yr. Via the MLR rule, either 15% (large group) or 20% (small group) of that should be the carrier's gross margin. The large group makes up the vast majority of group coverage, so let's say this averages around ~16%. That would leave around ~$8,356 which, in theory, should cover perhaps 84% of actual medical expenses. This would theoretically put average total medical expenses at around $9,948 per enrollee this year...which means, on average, ESI enrollees should have to spend around $1,592 in out of pocket costs.
If you were to take all of these numbers literally, that would theoretically mean the average ACA plan would cost around ~$1,056 less in premiums than the average ESI plan this year ($88 less/month), but they would also have to pay around $641 more in out of pocket expenses than someone with group coverage. On the other hand, ACA plans typically have worse provider networks than group coverage plans, so there's that to consider as well...
Again, this is all back-of-the-envelope math, and there's a bunch of additional caveats & disclaimers which I haven't included, but the larger point is that at at full price, ACA exchange coverage is neither dramatically more expensive nor significantly less expensive than comparable employer-sponsored coverage...the big factor is how much of that total cost the enrollee has to pay.
THAT'S where the expiration of the enhanced ACA subsidies has dealt such a crippling blow to the affordability of ACA coverage.
Here's an idea of what this looks like. For Employer-Sponsored Insurance (group coverage), employers pay the bulk of the premiums in order to get the tax write-off. According to KFF's data, this has ranged from around 80 - 85% of total premiums (for 2026 I'm using Bureau of Labor Statistics estimates). Note that this is for single person coverage only;
For the Individual market, until 2014, all enrollees had to pay the full cost of their premiums. From 2014 onward, the bulk of gross premiums have been paid for via federal tax credits, which effectively serve the same function for the individual market that the employer-paid portion of the premiums do for employer-sponsored insurance.
Note that there's a couple of important caveats in both categoreis:
- For group coverage, I'm basing this on KFF data for single worker coverage only, not family coverage, where employers typically pay a lower percentage of premiums. I had to do it this way in order to keep it consistent with the ACA data, which is for individual covered lives.
- For Individual/ACA market coverage, I calculated the average enrollee portion like so:
- Multiply the total number of enrollees by the average full-price premium (in 2024, for instance, this was 20.97M x $592/mo)
- Multiply the total number of enrollees receiving tax credits by the average amount of tax credits (in 2024, this was 19.53M x $528/mo)
- Subtract the total tax credits from the total gross premiums paid (in 2024, this was around $2.11 billion/mo)
- Divide that by the total gross premiums (in 2024, this was around 17% of the total)
As you can see below, the ACA tax credits brought average net premiums down considerably, but they still averaged far more than ESI premiums up until the enhanced tax credits were put into place in 2021...at which point they were made roughly equivalent overall.
This changed starting in 2026, of course, as the enhanced tax credits expired & net ACA premiums shot way up, from around $113/mo to $178/mo on average.
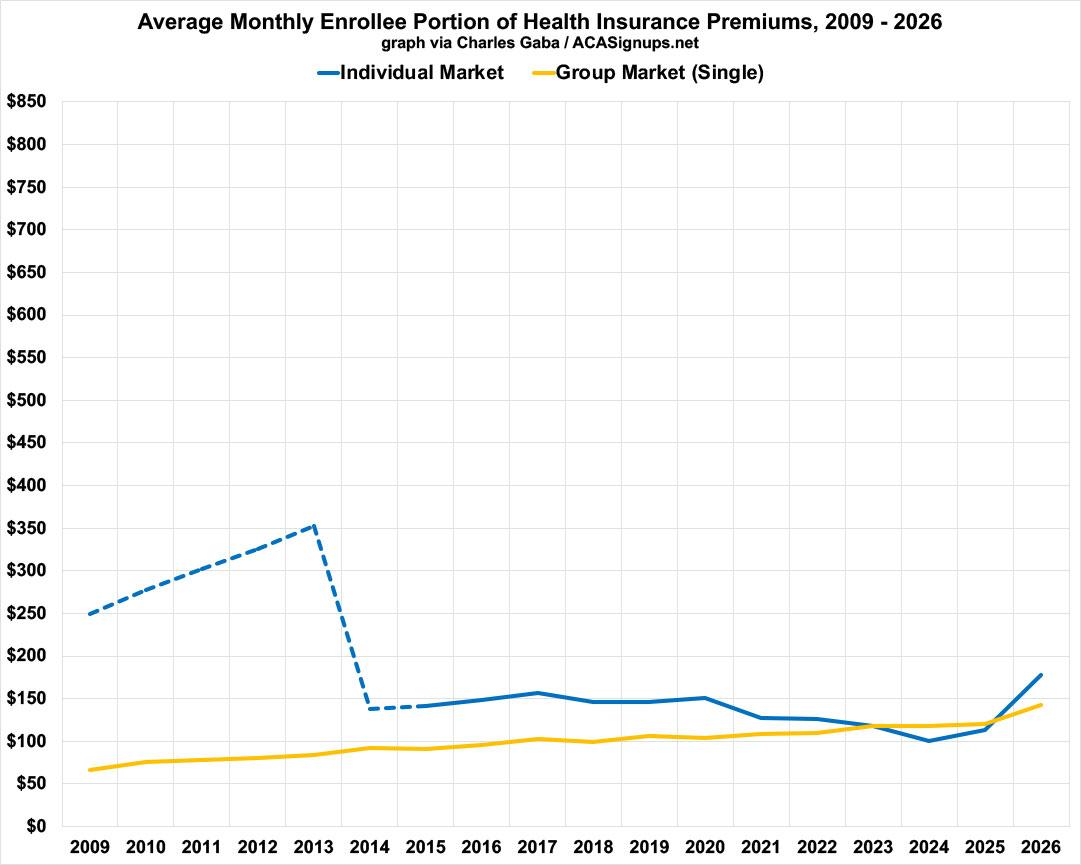
The bottom line is that the expiration of the enhanced tax credits means we're in a bit of an ironic situation: On average, gross individual market ACA policy premiums are still about ~10% lower than Employer-Sponsored insurance...but net ACA premiums (ie, what the enrollees actually pay) are now around 25% higher.
Advertisement