


Small enough to drown in a bathtub: How Trump & Congressional Republicans are shrinking ACA enrollment in nearly every state
Wed, 07/08/2026 - 1:58pm
Yesterday I noted that the Centers for Medicare & Medicaid Services (CMS) has published a new database which updates the official effectuated ACA exchange enrollment data for all 50 states (+DC) through February 2026.
This means that I finally have comprehensive effectuated enrollment data for the first two months of the year for every state, as opposed to only having Open Enrollment Period (OEP) plan selections, which aren't the same thing.
While there are still four months of effectuated enrollment data missing, this still fills in a lot of the missing pieces of the year over year enrollment puzzle, since this new database also includes state-level effectuations from August - December 2025 as well (previously I only had the national total for those months).
In addition, there's several states which provide their own monthly enrollment reports...although those numbers don't always match up perfectly with the official CMS reprots, since there can be differences in methodology, "as of" dates and so on. I'll get more into that below.
First, however, here's a table breaking out just how many Americans were enrolled in ACA exchange healthcare coverage as of February 2026 compared to one year earlier in February 2025:
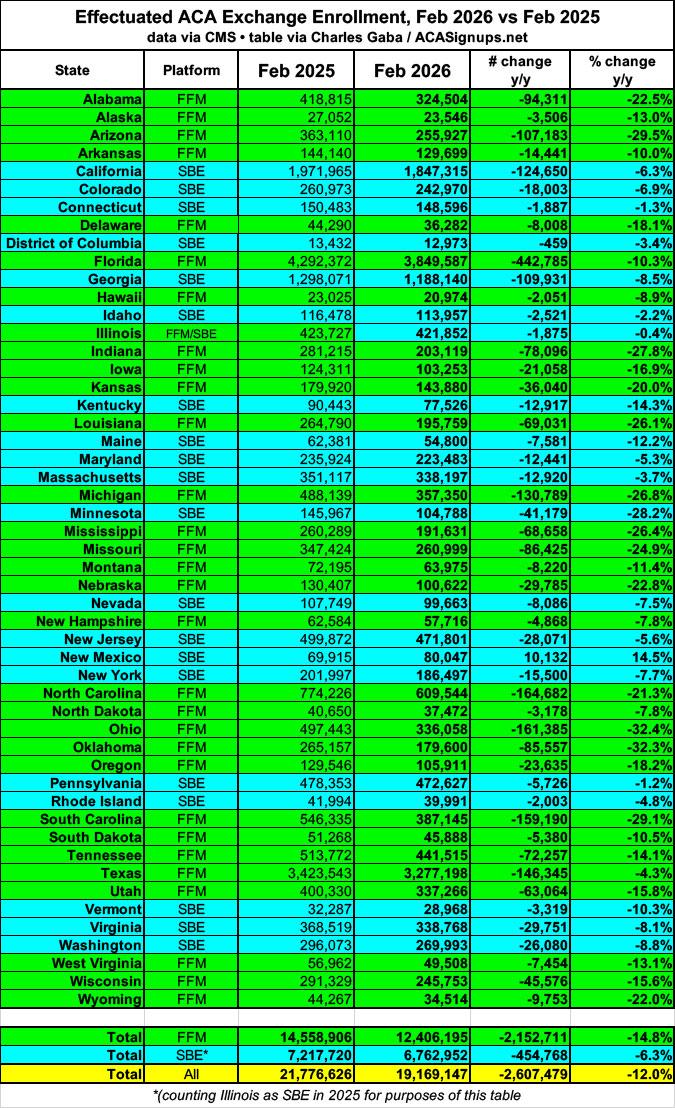
Nationally, effectuated enrollment has dropped by more than 2.6 million people year over year...with the vast bulk of this being found in states hosted by the federal exchange, while the state-based exchanges saw a smaller reduction (important caveat: Illinois switched from the federal exchange (HealthCare.Gov) to its own state-based exchange last fall, which skews the breakout for each category a bit; I'm counting IL as a SBE for purposes of this breakout).
Update: The 2025 FFM & SBE subtotals above have been corrected.
At the state level, there are 15 states which saw year over year enrollment drop by 20% or more: AL, AZ, IN, KS, LA, MI, MN, MS, MO, NE, NC, OH, OK, SC & WY. The biggest percentage drops were OHIO and OKLAHOMA, where February enrollment was more than 30% lower in 2026 than in 2025.
By contrast, there's exactly one state which saw a net increase in effectuated enrollment as of February: NEW MEXICO, which accomplished this thanks to the state fully backfilling 100% of all lost federal tax credits for 100% of their enrollees. They're they only state to pull this off, although several other states are covering all or at least some of the lost subsidies for a portion of their enrollees. As a result, New Mexico's effectuated enrollment as up a whopping 14.5% as of February...although even this still shows a bit of a drop from the OEP tally (2026 OEP selections were 17% higher than they were during the 2025 OEP).
While no other states were up year over year, there were several which saw drops of 5% or less as of February, including CT, DC, ID, IL, MA, PA, RI & TX. Connecticut and Massachusetts provide their own supplemental state financial subsidies, while Illinois, Pennsylvania and Texas all have robust Premium Alignment pricing policies which are helping mitigate the financial damage and limiting the enrollment losses.
Here's another way of looking at the data: This table compares effectuated coverage in each state as of February against the same number in January as well as the plan selection tally during the 2026 Open Enrollment Period itself, to give an idea of how misleading that initial OEP figure was (which, again, was already ~1.2 million lower than it was during the 2025 OEP):
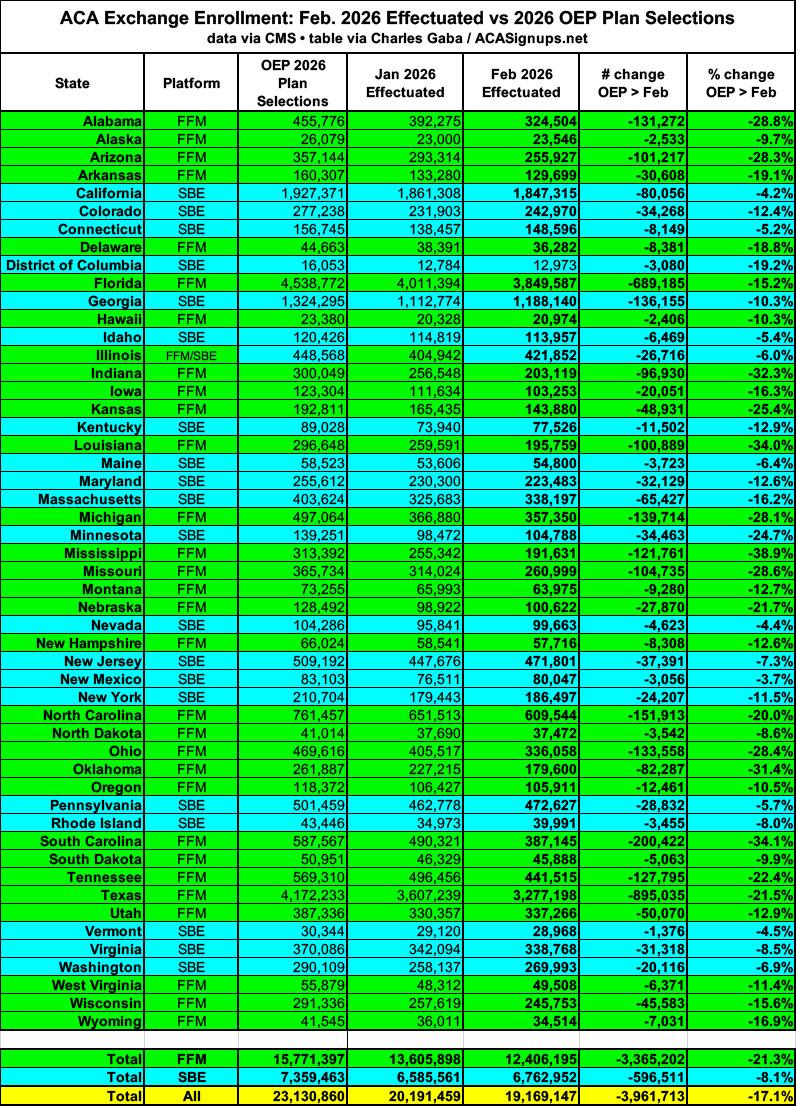
When you look at it this way, the drop is even more stark: Nationally, effectuated enrollment had dropped over 17% from the OEP total (which, again, was already down ~1.2 million from a year prior). That's nearly 4 million fewer actually enrolled in healthcare coverage than the official OEP plan selection report indicated.
At the state level, this ranges from only 3.7% lower in New Mexico to a stunning 39% drop in Mississippi. Sixteen states have seen their enrollment plummet by 20% or more apiece, five of which are down over 30% vs. the end of Open Enrollment.
Unlike my "cost analysis" series which I just wrapped up yesterday, I'm not going to create 51 separate blog posts about this data; instead, I'm going to highlight a few of the more noteworthy states.
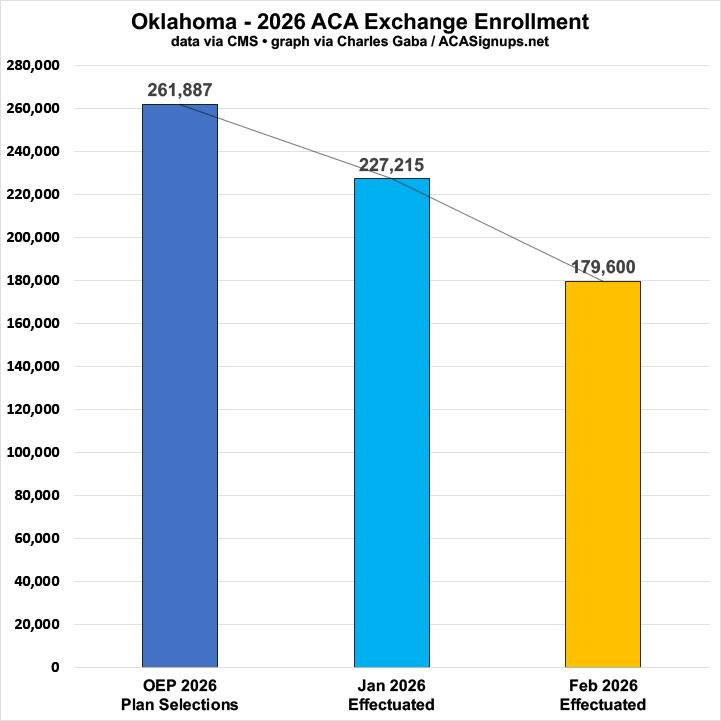
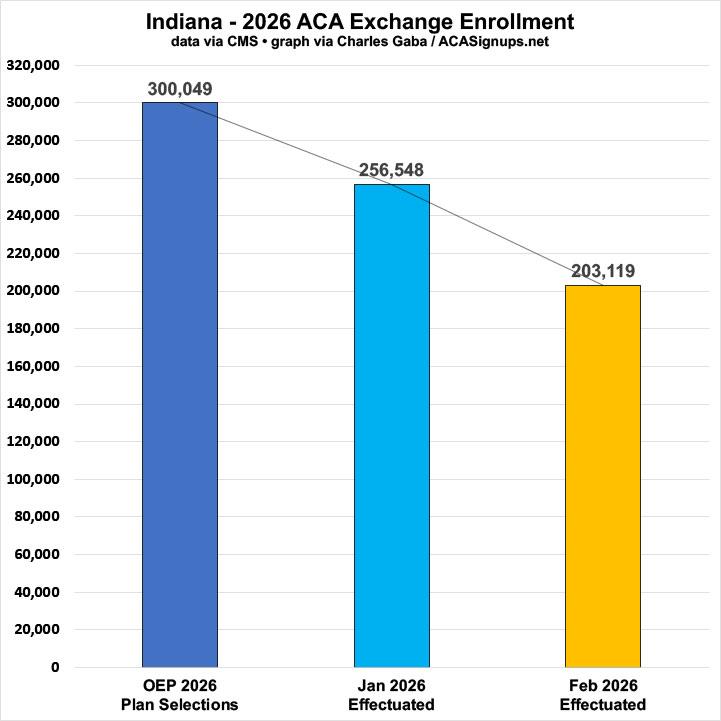
First up, here's the five states which saw the sharpest decline from OEP through February 2026: OK, IN, LA, SC & MS:
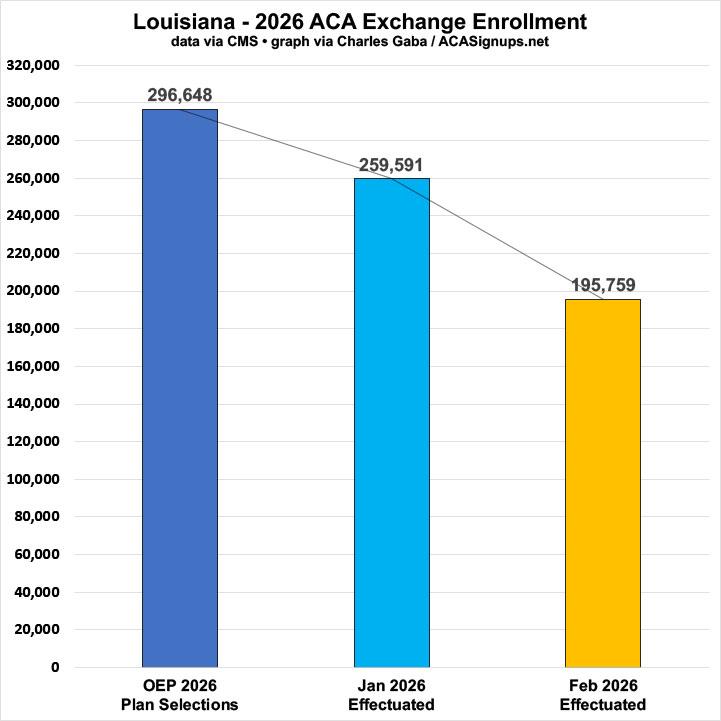
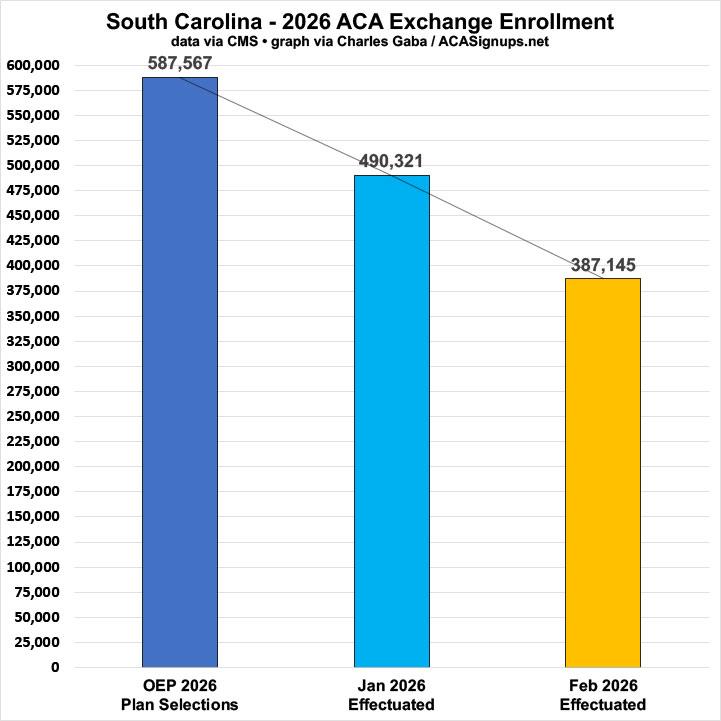
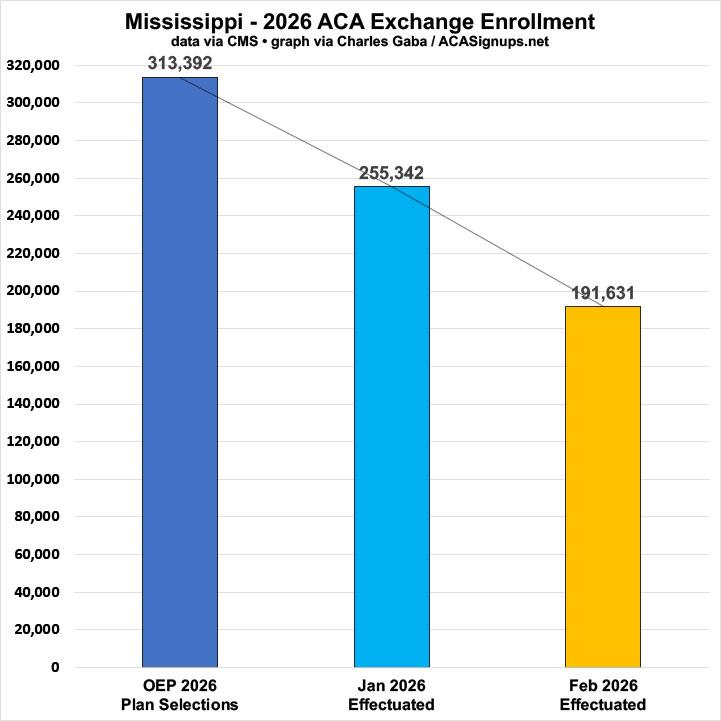
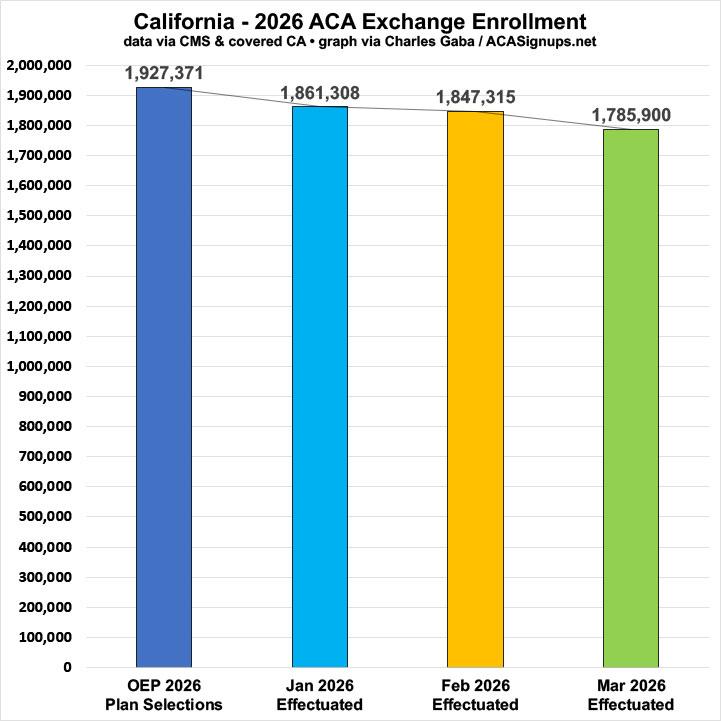
Next, here's the five states which have seen the smallest drop from 2026 OEP through later in the year...and again, thanks to all five of these providing their own regular effectuation reports, I have data from March or later for each of them. It's also worth noting that four of these five states provide supplemental state subsidies to some (or all in the case of New Mexico) of their ACA enrollees:
California: Covered California publishes a quarterly Active Member Profile, which means I have effectuated data thru March (down just 7.3% vs. the OEP total).
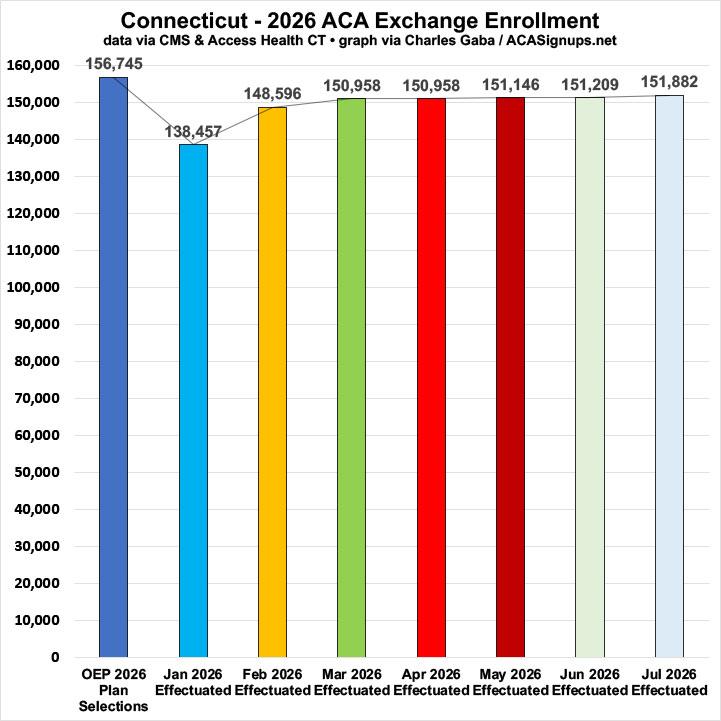
Connecticut: Access Health CT publishes a weekly enrollment dashboard, which means I have effectuated data all the way up through early July (down just 3.1% vs. the OEP total).
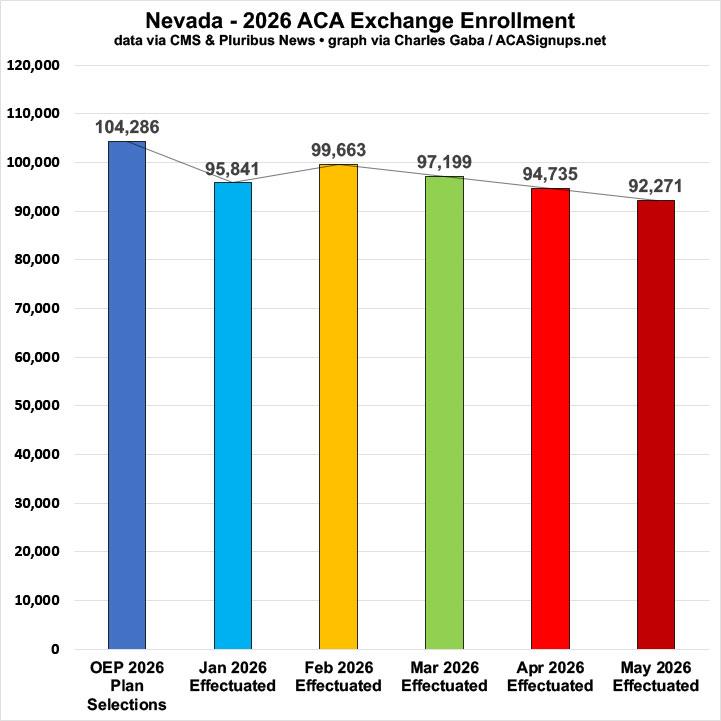
Nevada: According to a Plurbius News article from May 22nd, Nevada's effectuated enrollment had dropped by 11.5% since the OEP total as of May 1st.
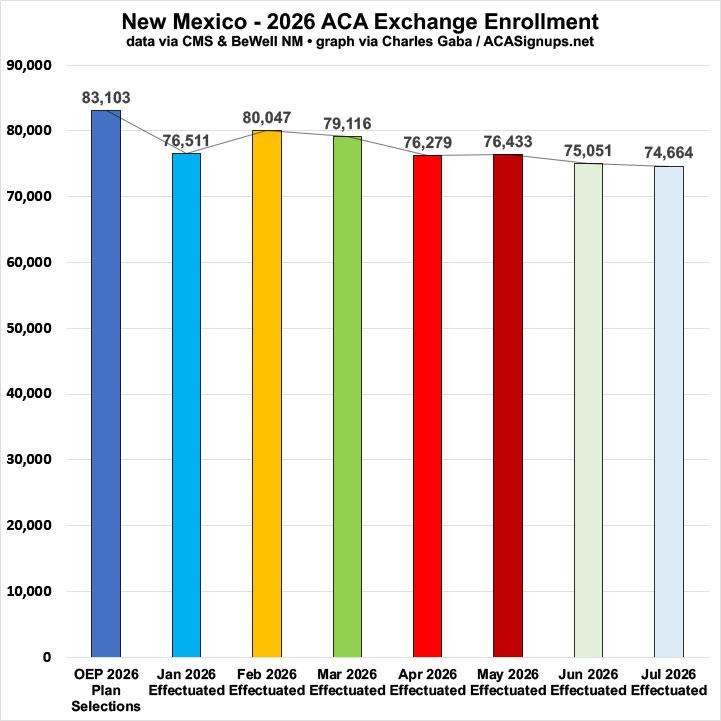
New Mexico: BeWell NM provides a monthly effectuated enrollment dashboard which is up to date through early July. Current enrollment sits at 74.6K, down 10.2% from OEP.
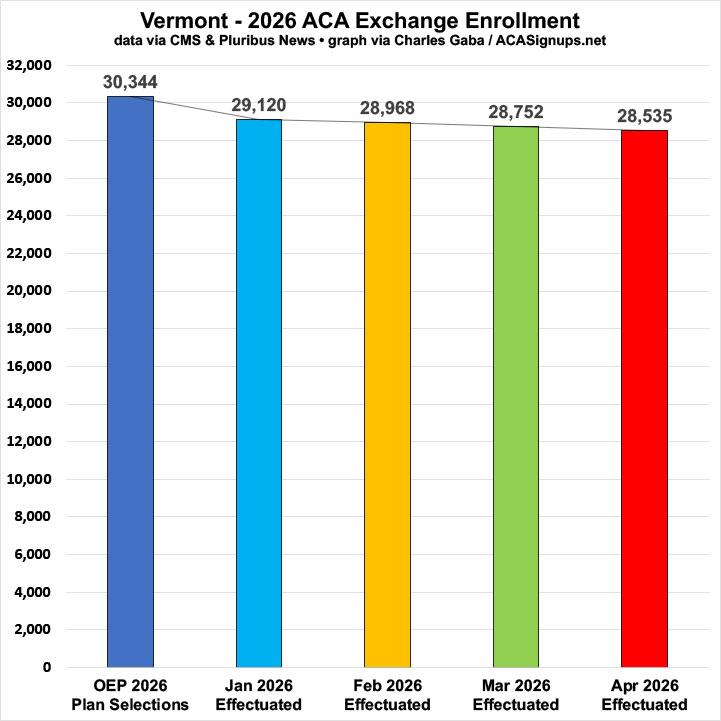
Vermont: According to the same Plurbius News story, Vermont's effectuated enrollment stood at 28.5K as of April, down 6.0% from the OEP tally.
Advertisement


