Whether the data posted since January 20, 2025 is accurate or not, I can't say for certain, but at least they're updating it...and so far, at least, I don't see anything in their monthly reports which is setting off any obvious red flags.
In any event, according to the latest report, as of September 2025:
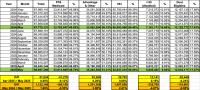
Total Medicare beneficiaries are up to 69.36 million (up ~77K month over month)
Traditional/FFM Medicare beneficiaries are at 33.79 million (flat m/m)
Medicare Advantage beneficiaries reached 35.57 million (up ~77K m/m)
12.12 million Medicare enrollees (around 17.5% of the total) were "Dual Eligibles"...that is, enrolled in both Medicare and Medicaid.
The only number which seems odd is the 384K increase in Dual Eligibles...I'm not sure what to make of that.
Whether the data posted since January 20, 2025 is accurate or not, I can't say for certain, but at least they're updating it...and so far, at least, I don't see anything in their monthly reports which is setting off any obvious red flags.
In any event, according to the latest report, as of August 2025:
Total Medicare beneficiaries are up to 69.3 million (up ~86K month over month)
Traditional/FFM Medicare beneficiaries are at 33.79 million (down ~31K m/m)
Medicare Advantage beneficiaries reached 35.49 million (up ~55K m/m)
11.73 million Medicare enrollees (around 16.9% of the total) were "Dual Eligibles"...that is, enrolled in both Medicare and Medicaid.
The only number which seems odd is the 375K drop in Dual Eligibles...I'm not sure what to make of that.
In all the (understandable) panic & controversy over the enhanced ACA tax credits expiring just 6 weeks from today, I wanted to take a quick moment to note that the 2026 Medicare Parts A & B Premiums & Deductible increases have been formally published by the Centers for Medicare & Medicaid Services:
On November 14, 2025, the Centers for Medicare & Medicaid Services (CMS) released the 2026 premiums, deductibles, and coinsurance amounts for the Medicare Part A and Part B programs, and the 2026 Medicare Part D income-related monthly adjustment amounts.
Medicare Part A Premium and Deductible
Medicare Part A covers inpatient hospital, skilled nursing facility, hospice, inpatient rehabilitation, and some home health care services. Approximately 99% of Medicare beneficiaries do not have a Part A premium since they have at least 40 quarters of Medicare-covered employment, as determined by the Social Security Administration.
Whether the data posted since January 20, 2025 is accurate or not, I can't say for certain, but at least they're updating it...and so far, at least, I don't see anything in their monthly reports which is setting off any obvious red flags.
In any event, according to the latest report, as of June 2025:
Whether the data posted since January 20, 2025 is accurate or not, I can't say for certain, but at least they're updating it...and so far, at least, I don't see anything in their monthly reports which is setting off any obvious red flags.
In any event, according to the latest report, as of May 2025: